
Fig. S2
- ID
- ZDB-IMAGE-180620-23
- Publication
- Auer et al., 2018 - Evidence for Myelin Sheath Remodeling in the CNS Revealed by In Vivo Imaging
- All Figures
- Figures for Auer et al., 2018
|
Fig. S2
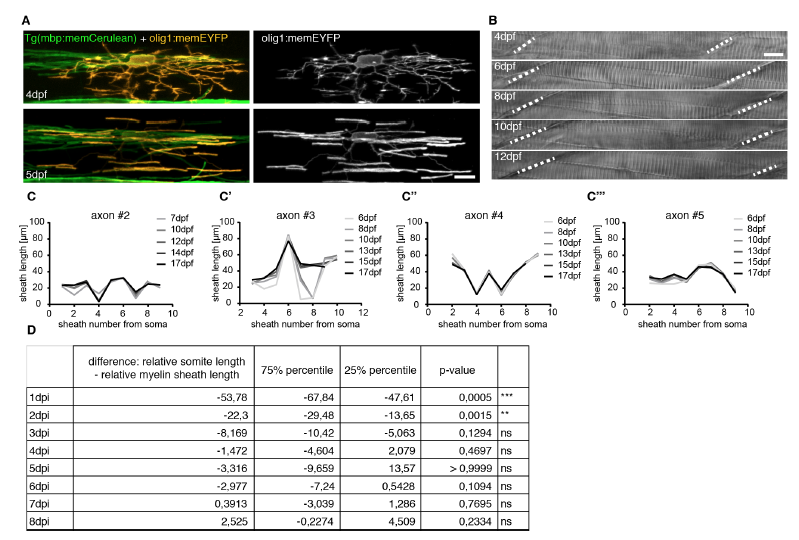
Characterisation of reporter constructs, animal growth, and additional information on axon myelination patterns over time. Related to Figures 2 and 3.
A) Confocal images of an individual olig1:memEYFP oligodendrocyte in Tg(mbp:memCerulean) full transgenic animals at the onset of myelin sheath formation (top) and one day later (bottom). Scale bar: 10μm.
B) Transmitted light images of an individual zebrafish between 4 and 12 dpf. Dashed lines indicate boundaries between two somites. Scale bar: 10μm.
C-C’’’) Quantification of body growth corrected myelin sheath distribution along 4 individual axons between 6 and 17dpf.
D) Quantification of the relative difference between somite and internode length at different time points after sheath initiation. Expression of data and significances are given in Fig. 2B’.