
Fig. 4
- ID
- ZDB-IMAGE-180620-19
- Publication
- Auer et al., 2018 - Evidence for Myelin Sheath Remodeling in the CNS Revealed by In Vivo Imaging
- All Figures
- Figures for Auer et al., 2018
|
Fig. 4
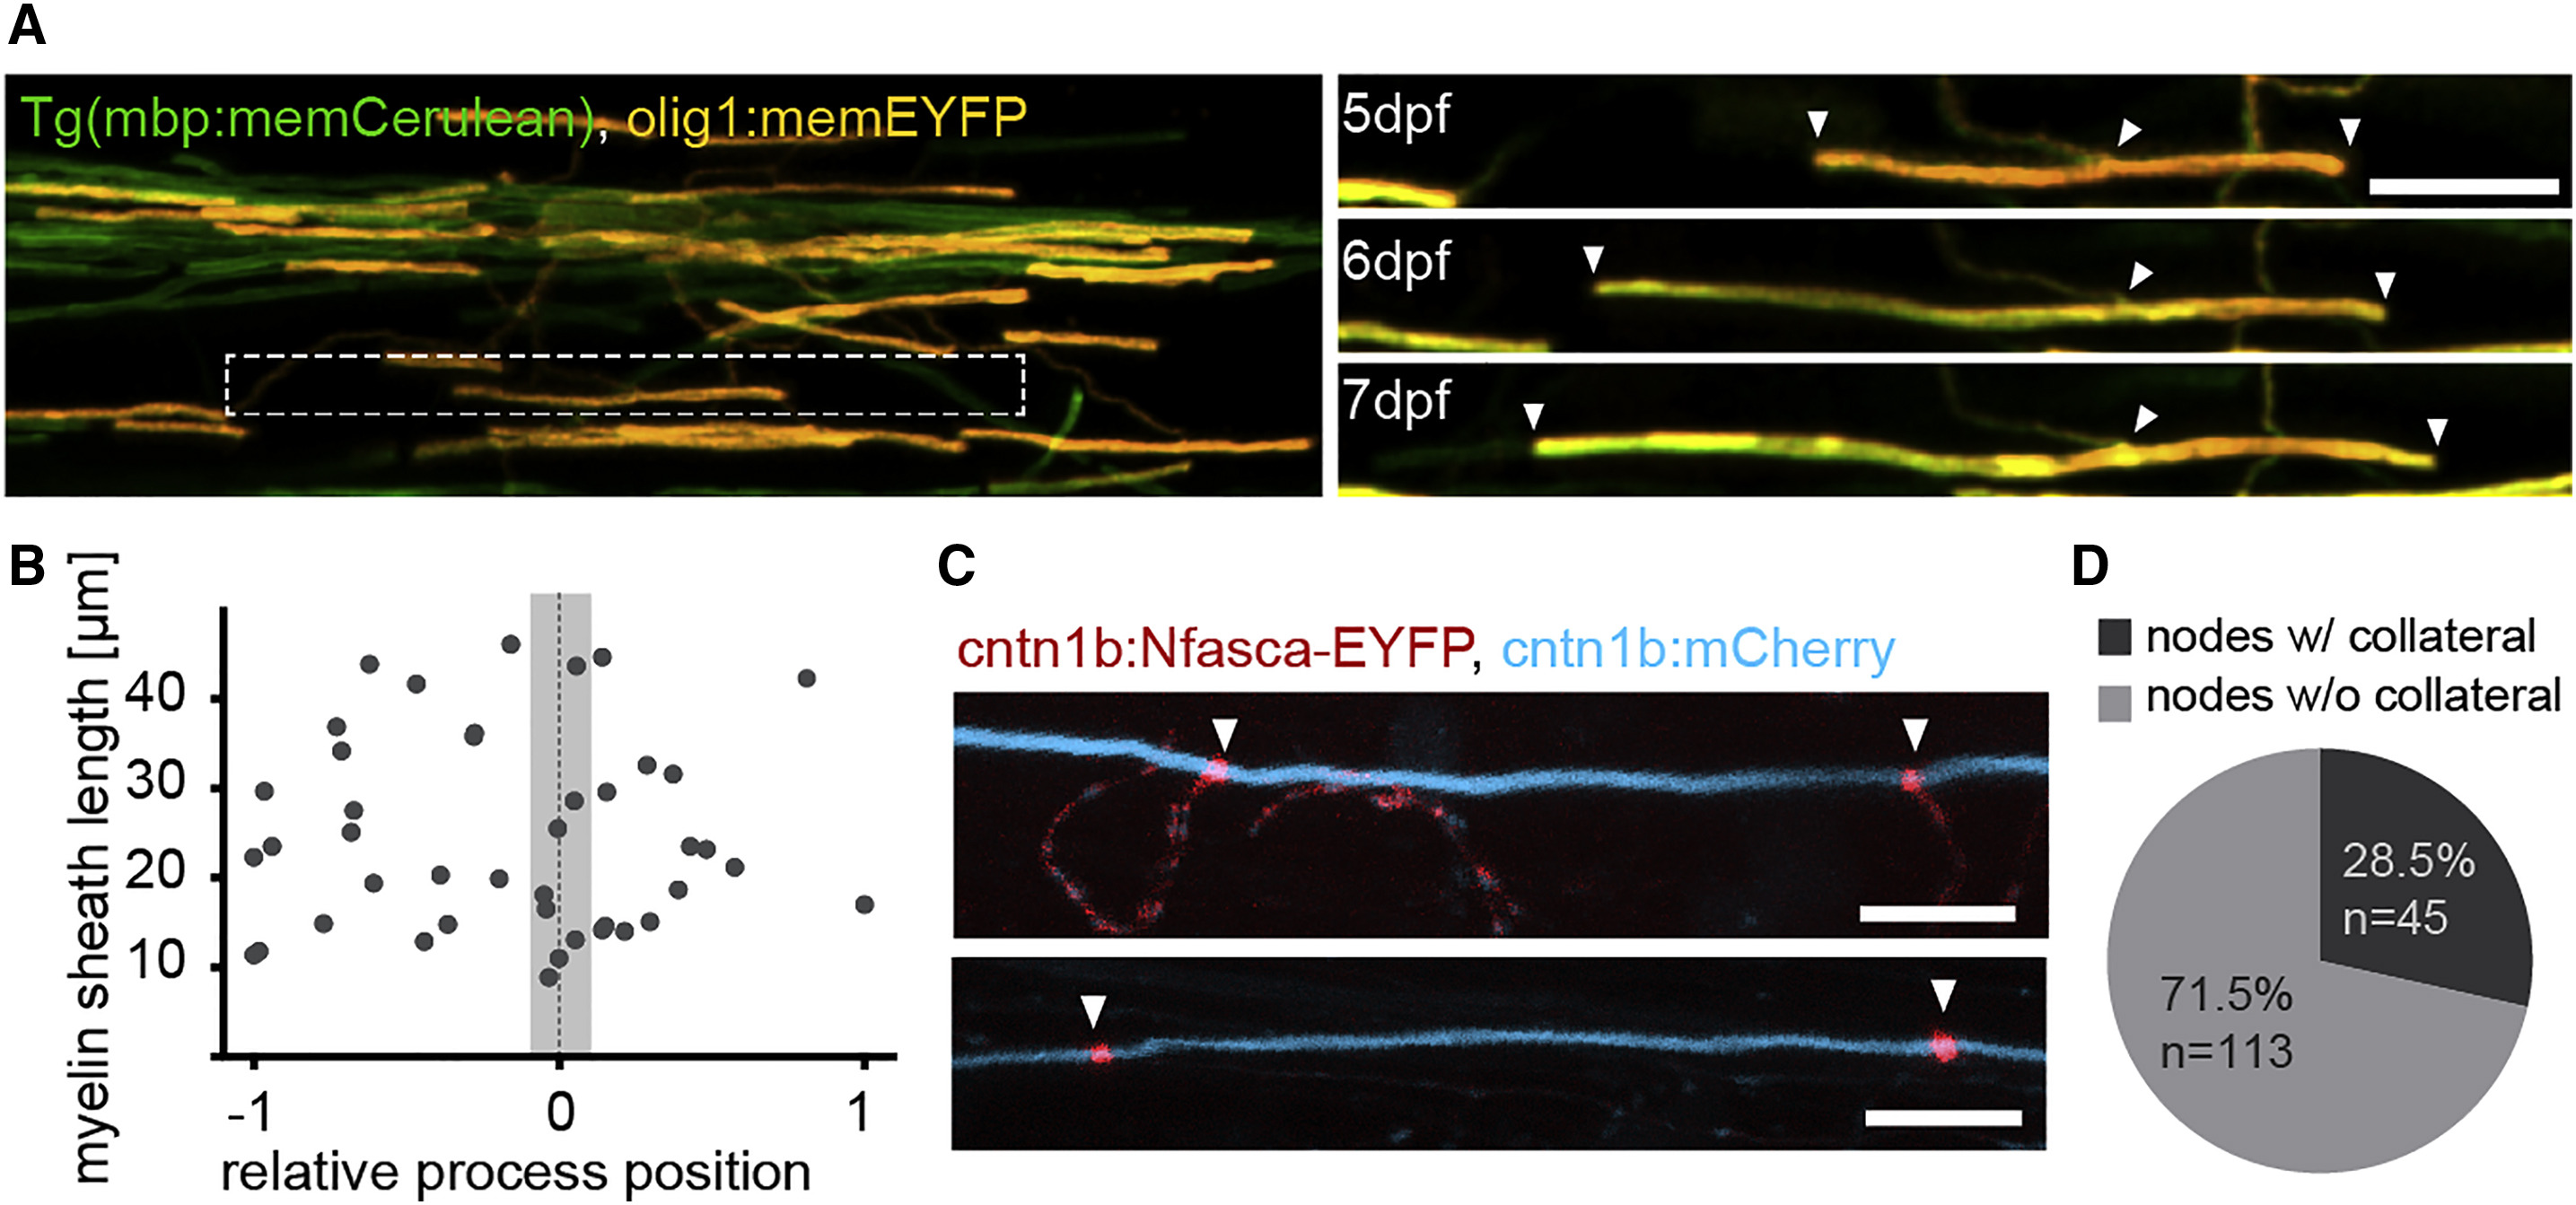
Evidence for Control of Myelin Sheath Length and Positioning by Axons
(A) Timeline of confocal images of an olig1:memEYFP-labeled oligodendrocyte in a transgenic Tg(mbp:memCerulean) zebrafish between 5 and 7 days post-fertilization (dpf). Scale bar, 10 μm. Arrowheads depict the feeding process and the ends of the respective sheath.
(B) Quantification of the position of the oligodendrocyte process relative to its sheath length. −1 and +1 refer to the anterior and posterior end of the sheath, respectively.
(C) Confocal images of cntn1b:mCherry, cntn1b:NFasca-EYFP-expressing myelinated axons with (top) and without (bottom) collateral branches at the node of Ranvier. Scale bar, 10 μm.
(D) Quantification of NFasca-EYFP-labeled nodes of Ranvier with and without collateral axon branches.
See also Movie S1.