
Fig. 1
- ID
- ZDB-IMAGE-180620-16
- Publication
- Auer et al., 2018 - Evidence for Myelin Sheath Remodeling in the CNS Revealed by In Vivo Imaging
- All Figures
- Figures for Auer et al., 2018
|
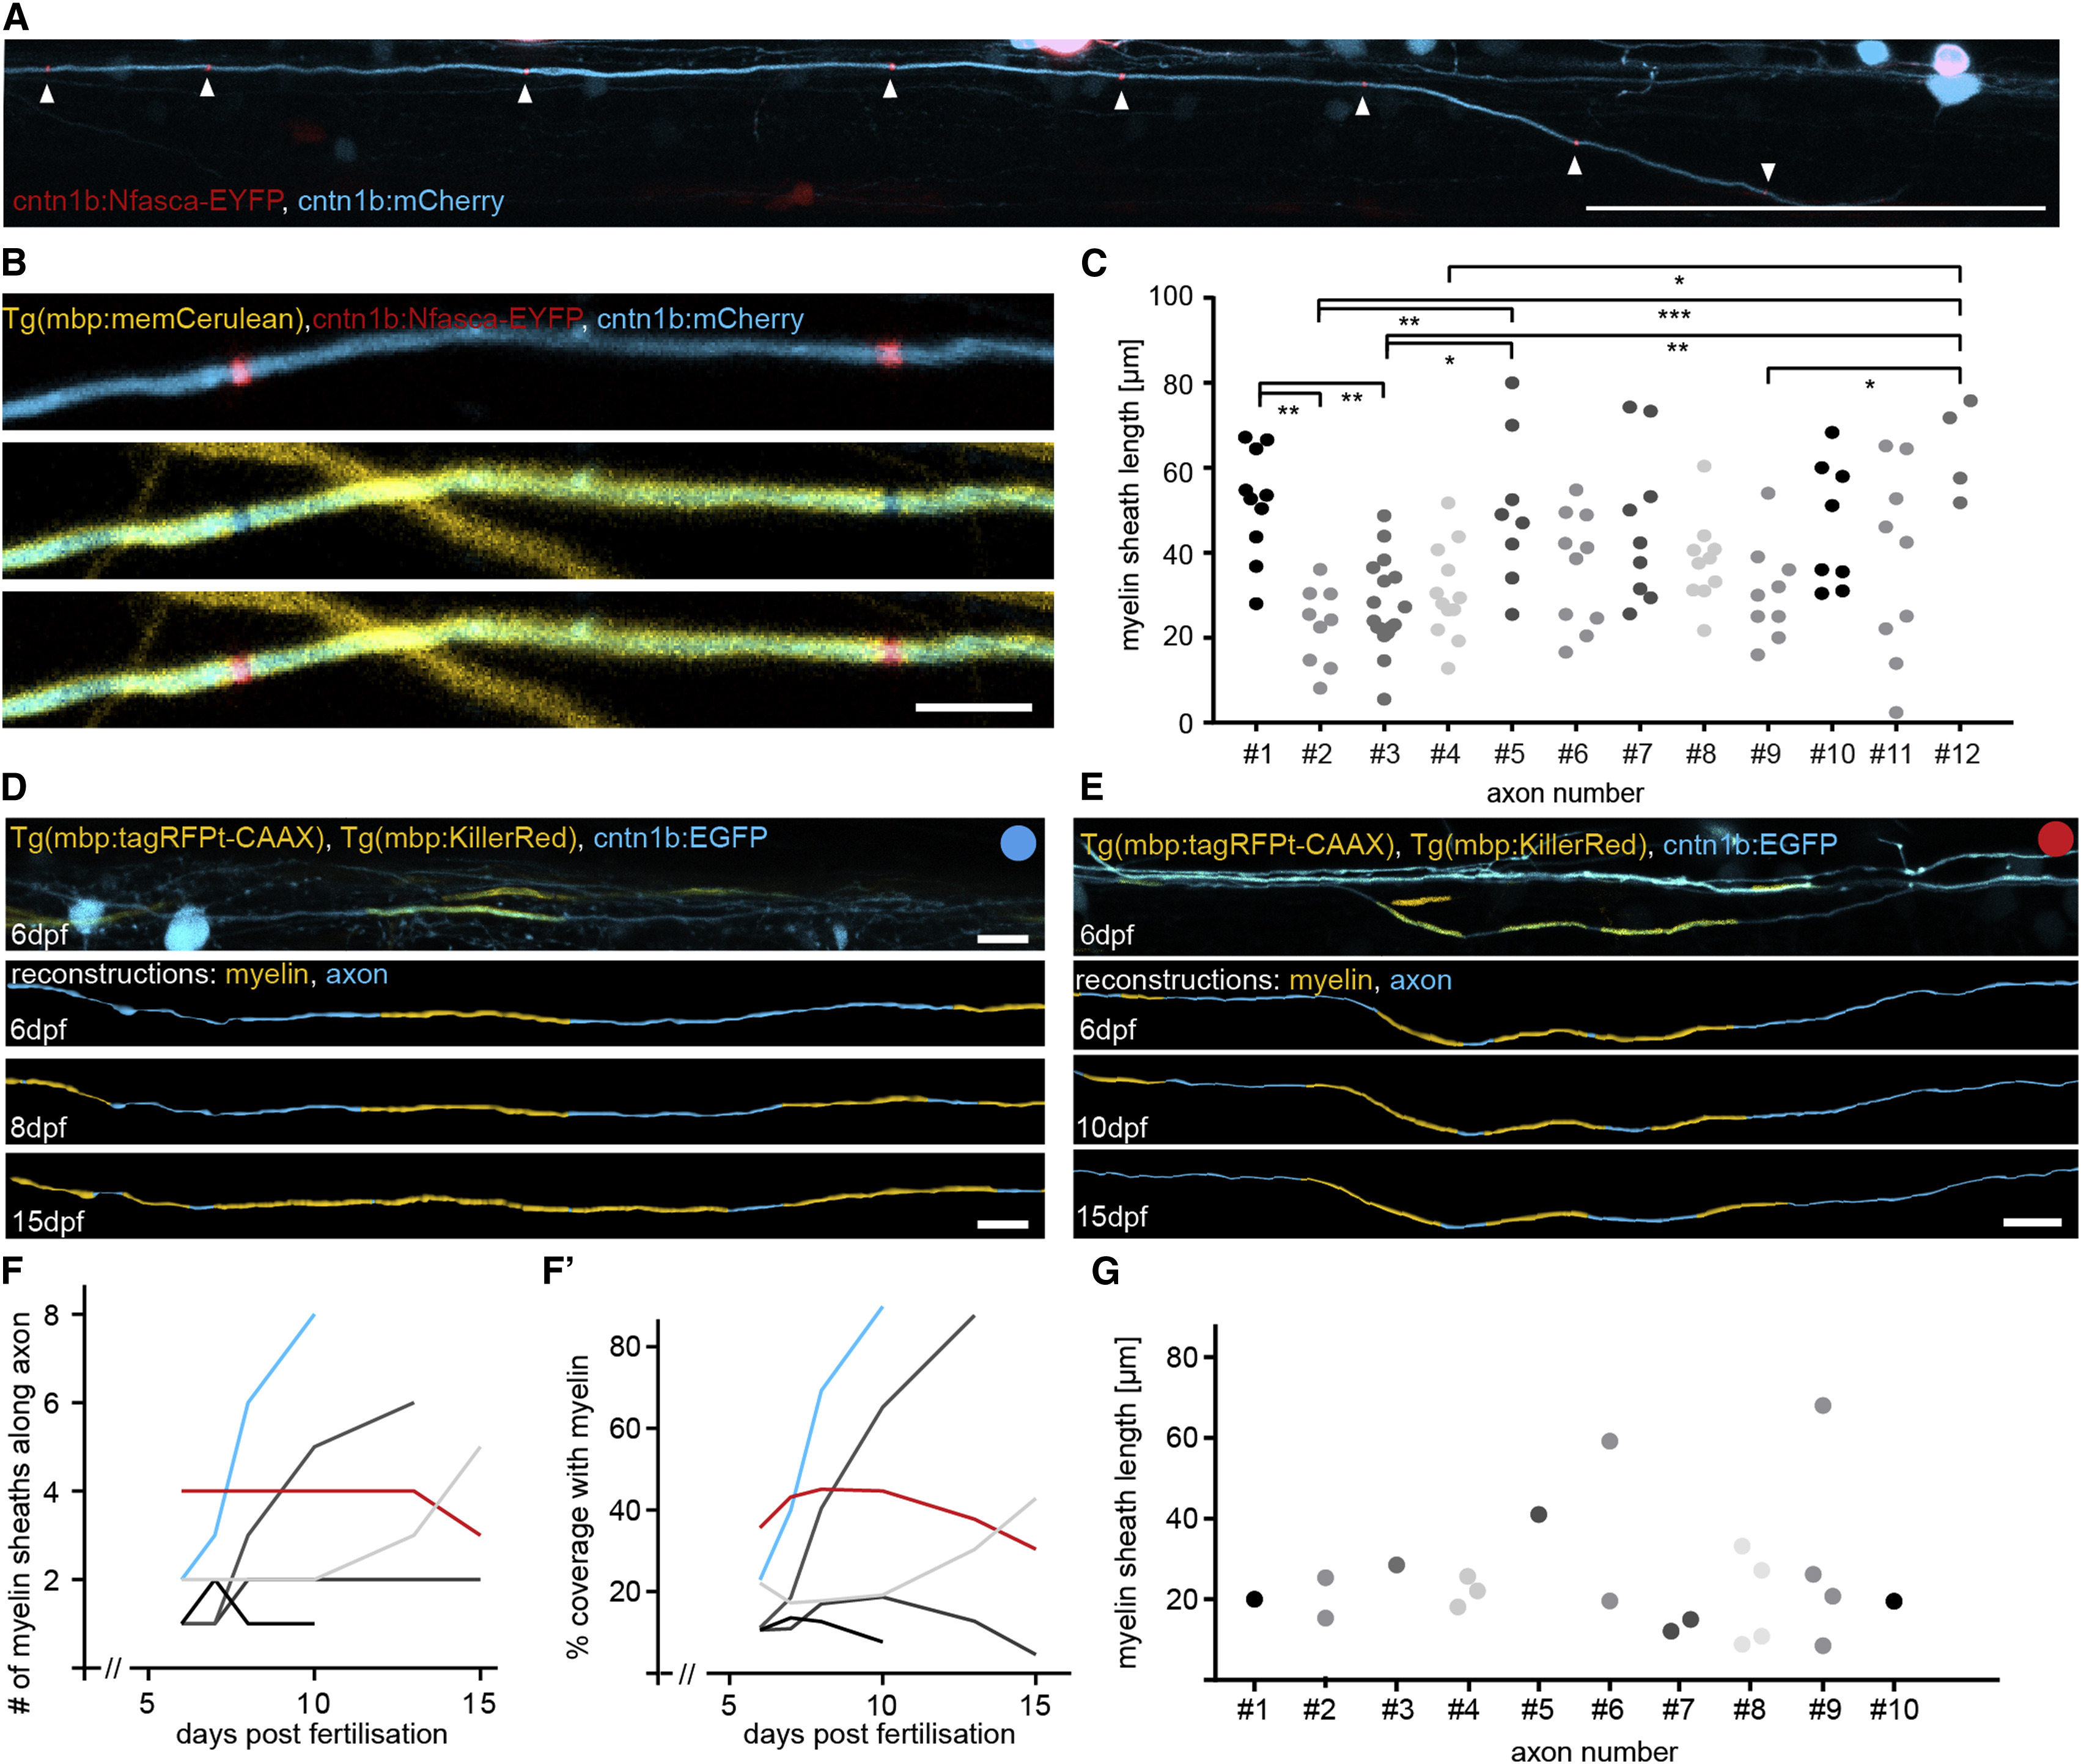
Fig. 1
Variability of Myelin Sheath Length along and across Axons
(A) Confocal image of a spinal cord neuron expressing cntn1b:mCherry and cntn1b:Nfasca-EYFP at 7 days post-fertilization (dpf). Scale bar, 100 μm.
(B) Confocal image of a spinal cord neuron expressing cntn1b:mCherry and cntn1b:Nfasca-EYFP in Tg(mbp:memCerulean) transgenic animals at 7 dpf. Scale bar, 10 μm.
(C) Quantification of myelin sheath length (determined by internodal distance) along 12 axons at 7–8 dpf. Axons #1–10 were located in the middle/dorsal tracts of the spinal cord, #11, 12 in the ventral tract (Tukey’s multiple comparison test, ANOVA summary: p < 0.001, F(14,128) = 3,986).
(D and E) Confocal image (top) and timeline of reconstructions of confocal stacks (bottom three) of a partially myelinated cntn1b:EGFP-expressing axon in Tg(mbp:tagRFPt-CAAX), Tg(mbp:KR) transgenic animals showing increasing (D) and stable myelination (E) from 6 to 15 dpf. Scale bar, 10 μm.
(F and F′) Quantification of myelin sheath number along individual axon stretches (F) and the percentage of myelin coverage of this stretch (F′). Examples shown in (D) and (E) are colored blue and red, respectively.
(G) Quantification of myelin sheath lengths along 10 partially myelinated axons at 7–8 dpf.
See also Figure S1.