
Image
|
Figure Caption
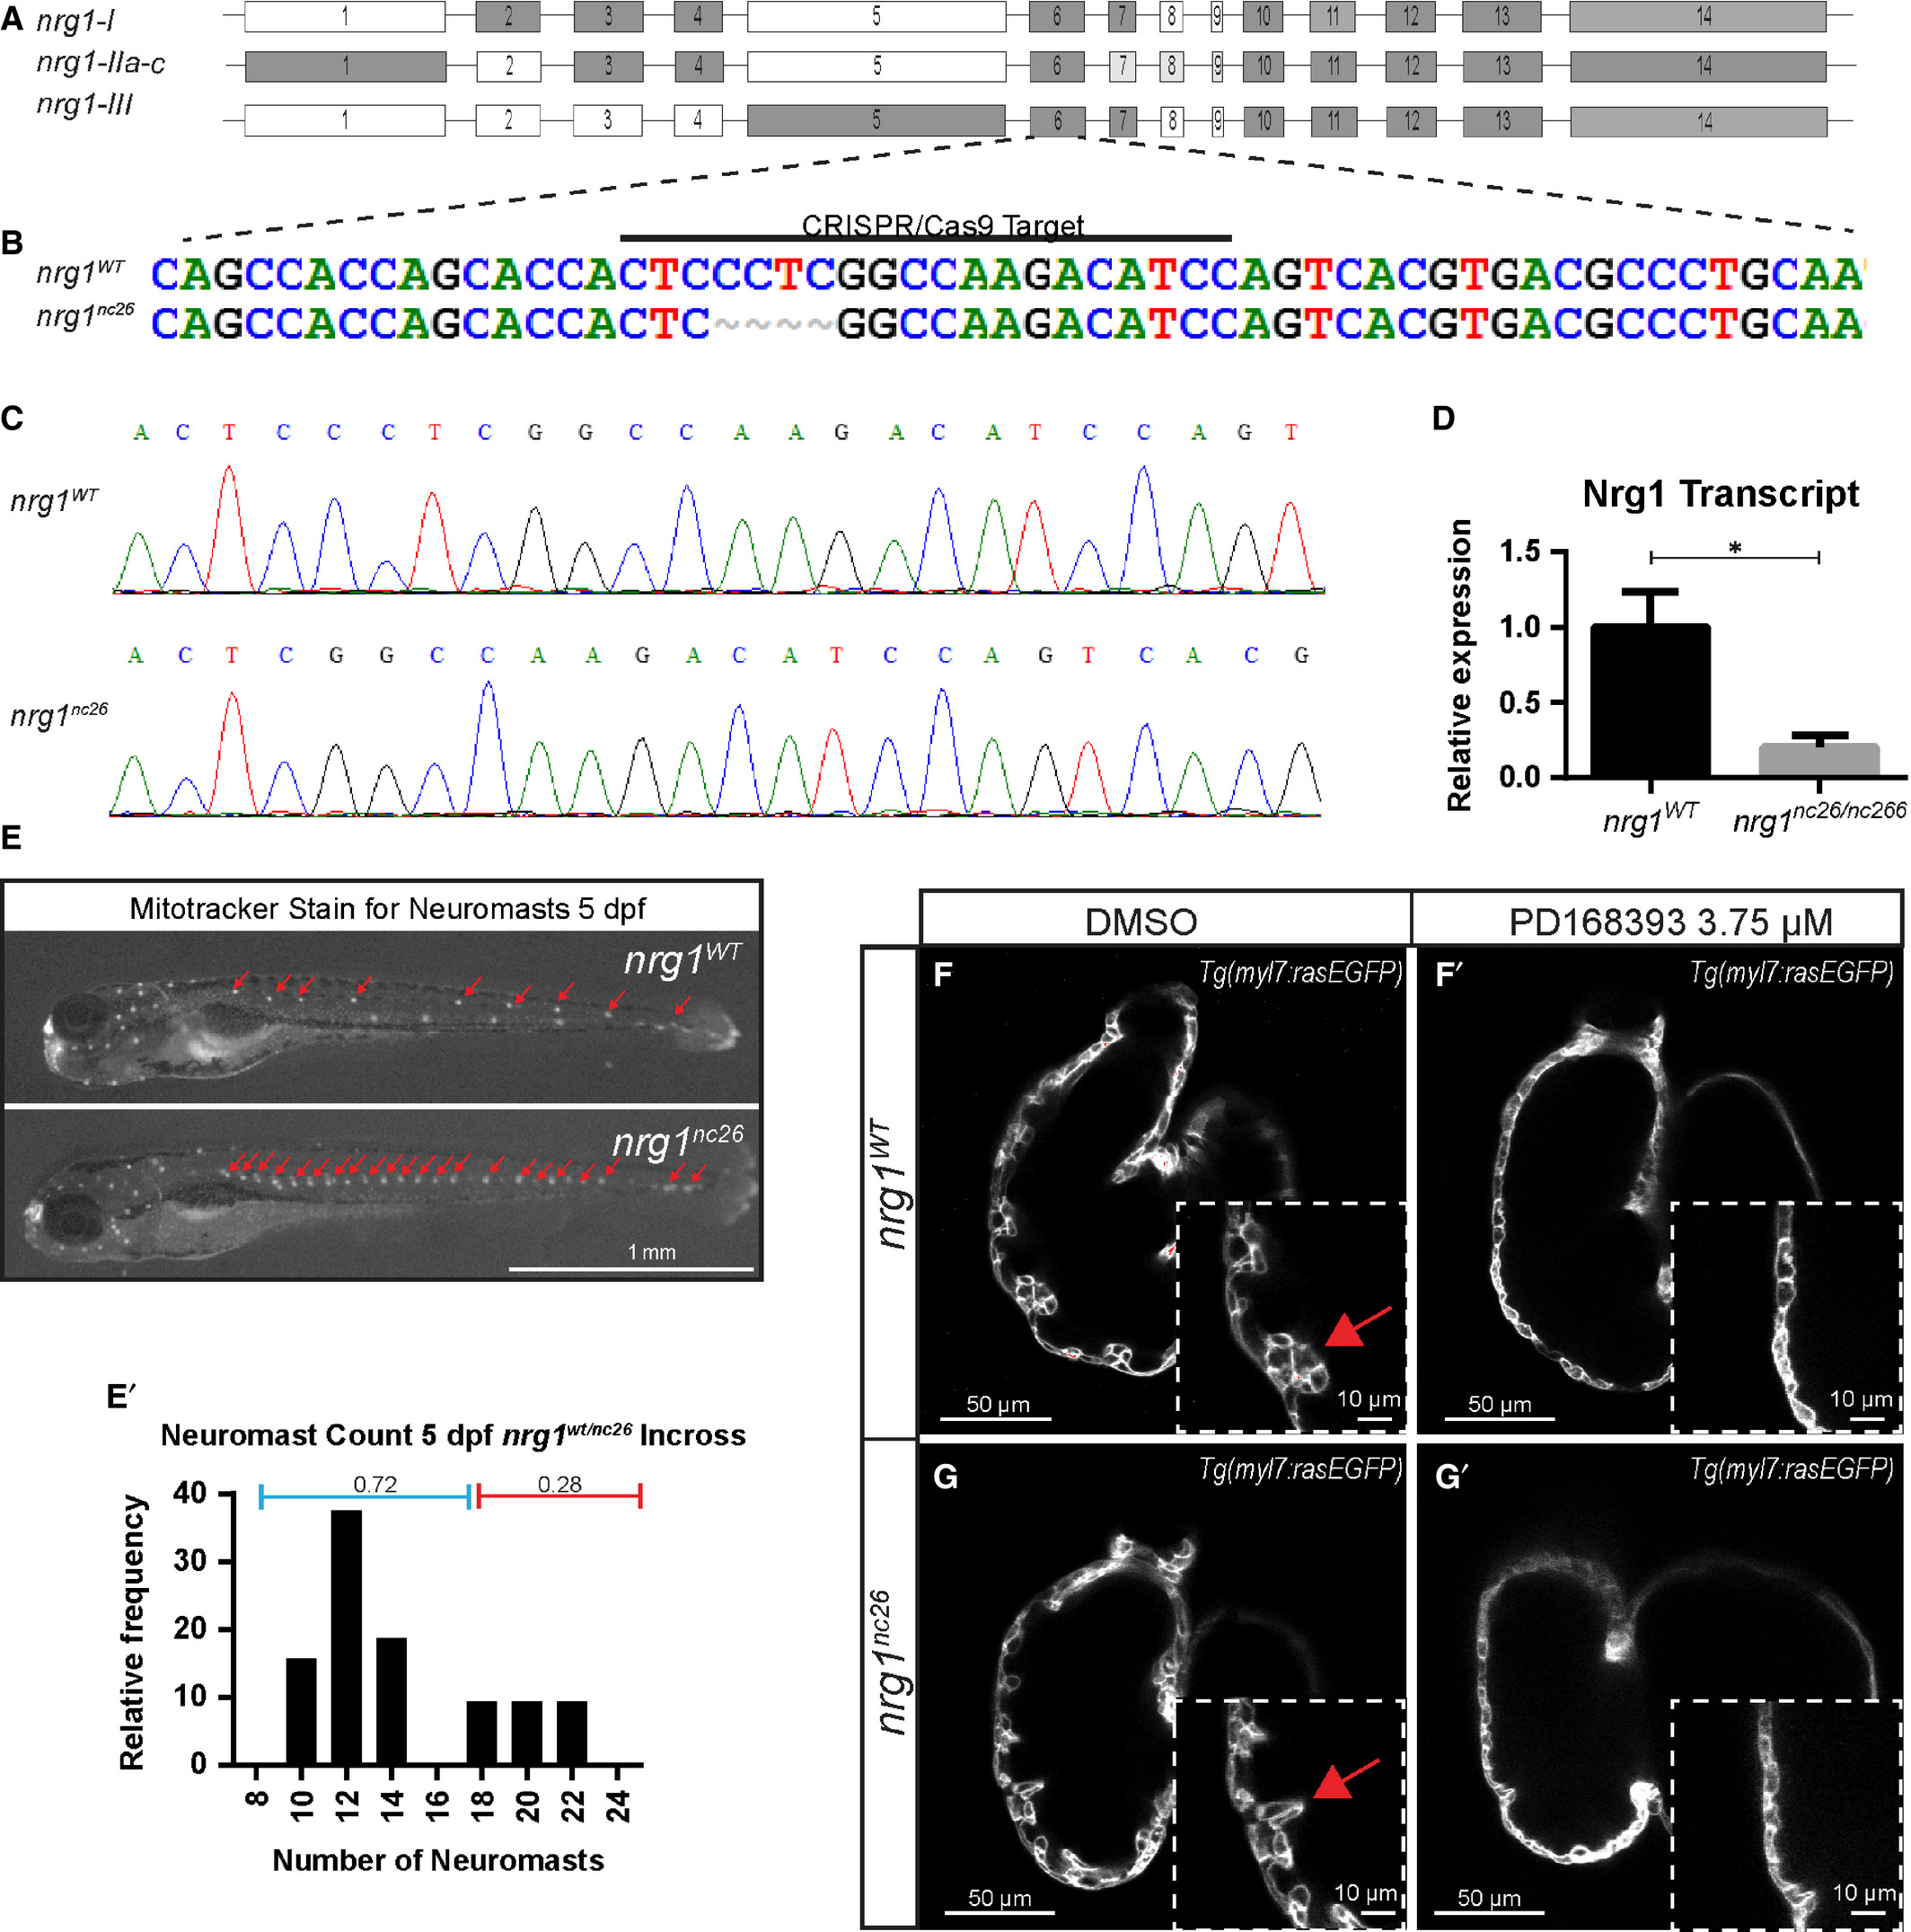
Fig. 1
Generation and validation of nrg1nc26 allele. (A) Gene structure of zebrafish nrg1 (exons drawn to scale). Alternative splicing produces three primary isoforms, nrg1‐I, nrg1‐IIa‐c and nrg1‐III. (B, C) CRISPR/Cas9 targeting at Exon 6 produced the nrg1nc26 allele with a four amino acid deletion. (D) Detection of nrg1 mRNA transcripts spanning Exons 6–10 by qPCR; statistical significance determined by t‐test, *P < 0.05. (E) Representative nrg1wt and nrg1nc26/nc26 clutchmates stained with Mitotracker Red to detect neuromasts in the developing lateral line at 4–5 dpf. Red arrows designate neuromasts. (E’) Relative frequency of the number of neuromasts counted in embryos from heterozygous incrosses of nrg1wt/nc26 fish, N > 24 larvae. (F‐G’) Representative confocal optical mid‐chamber slice of the ventricle at 3–4 dpf in larvae carrying Tg(myl7:rasGFP) cardiomyocyte reporters and treated with DMSO or 3.75 μM ErbB2 inhibitor PD168393. Boxes include high‐resolution image of the outer curvature. Red arrows point to developing trabeculae.
Figure Data
Acknowledgments
This image is the copyrighted work of the attributed author or publisher, and
ZFIN has permission only to display this image to its users.
Additional permissions should be obtained from the applicable author or publisher of the image.
Full text @ J. Cell. Mol. Med.