
Fig. 6
- ID
- ZDB-IMAGE-180608-87
- Genes
- Publication
- Dasgupta et al., 2018 - Cell volume changes contribute to epithelial morphogenesis in zebrafish Kupffer's vesicle
- All Figures
- Figures for Dasgupta et al., 2018
|
Fig. 6
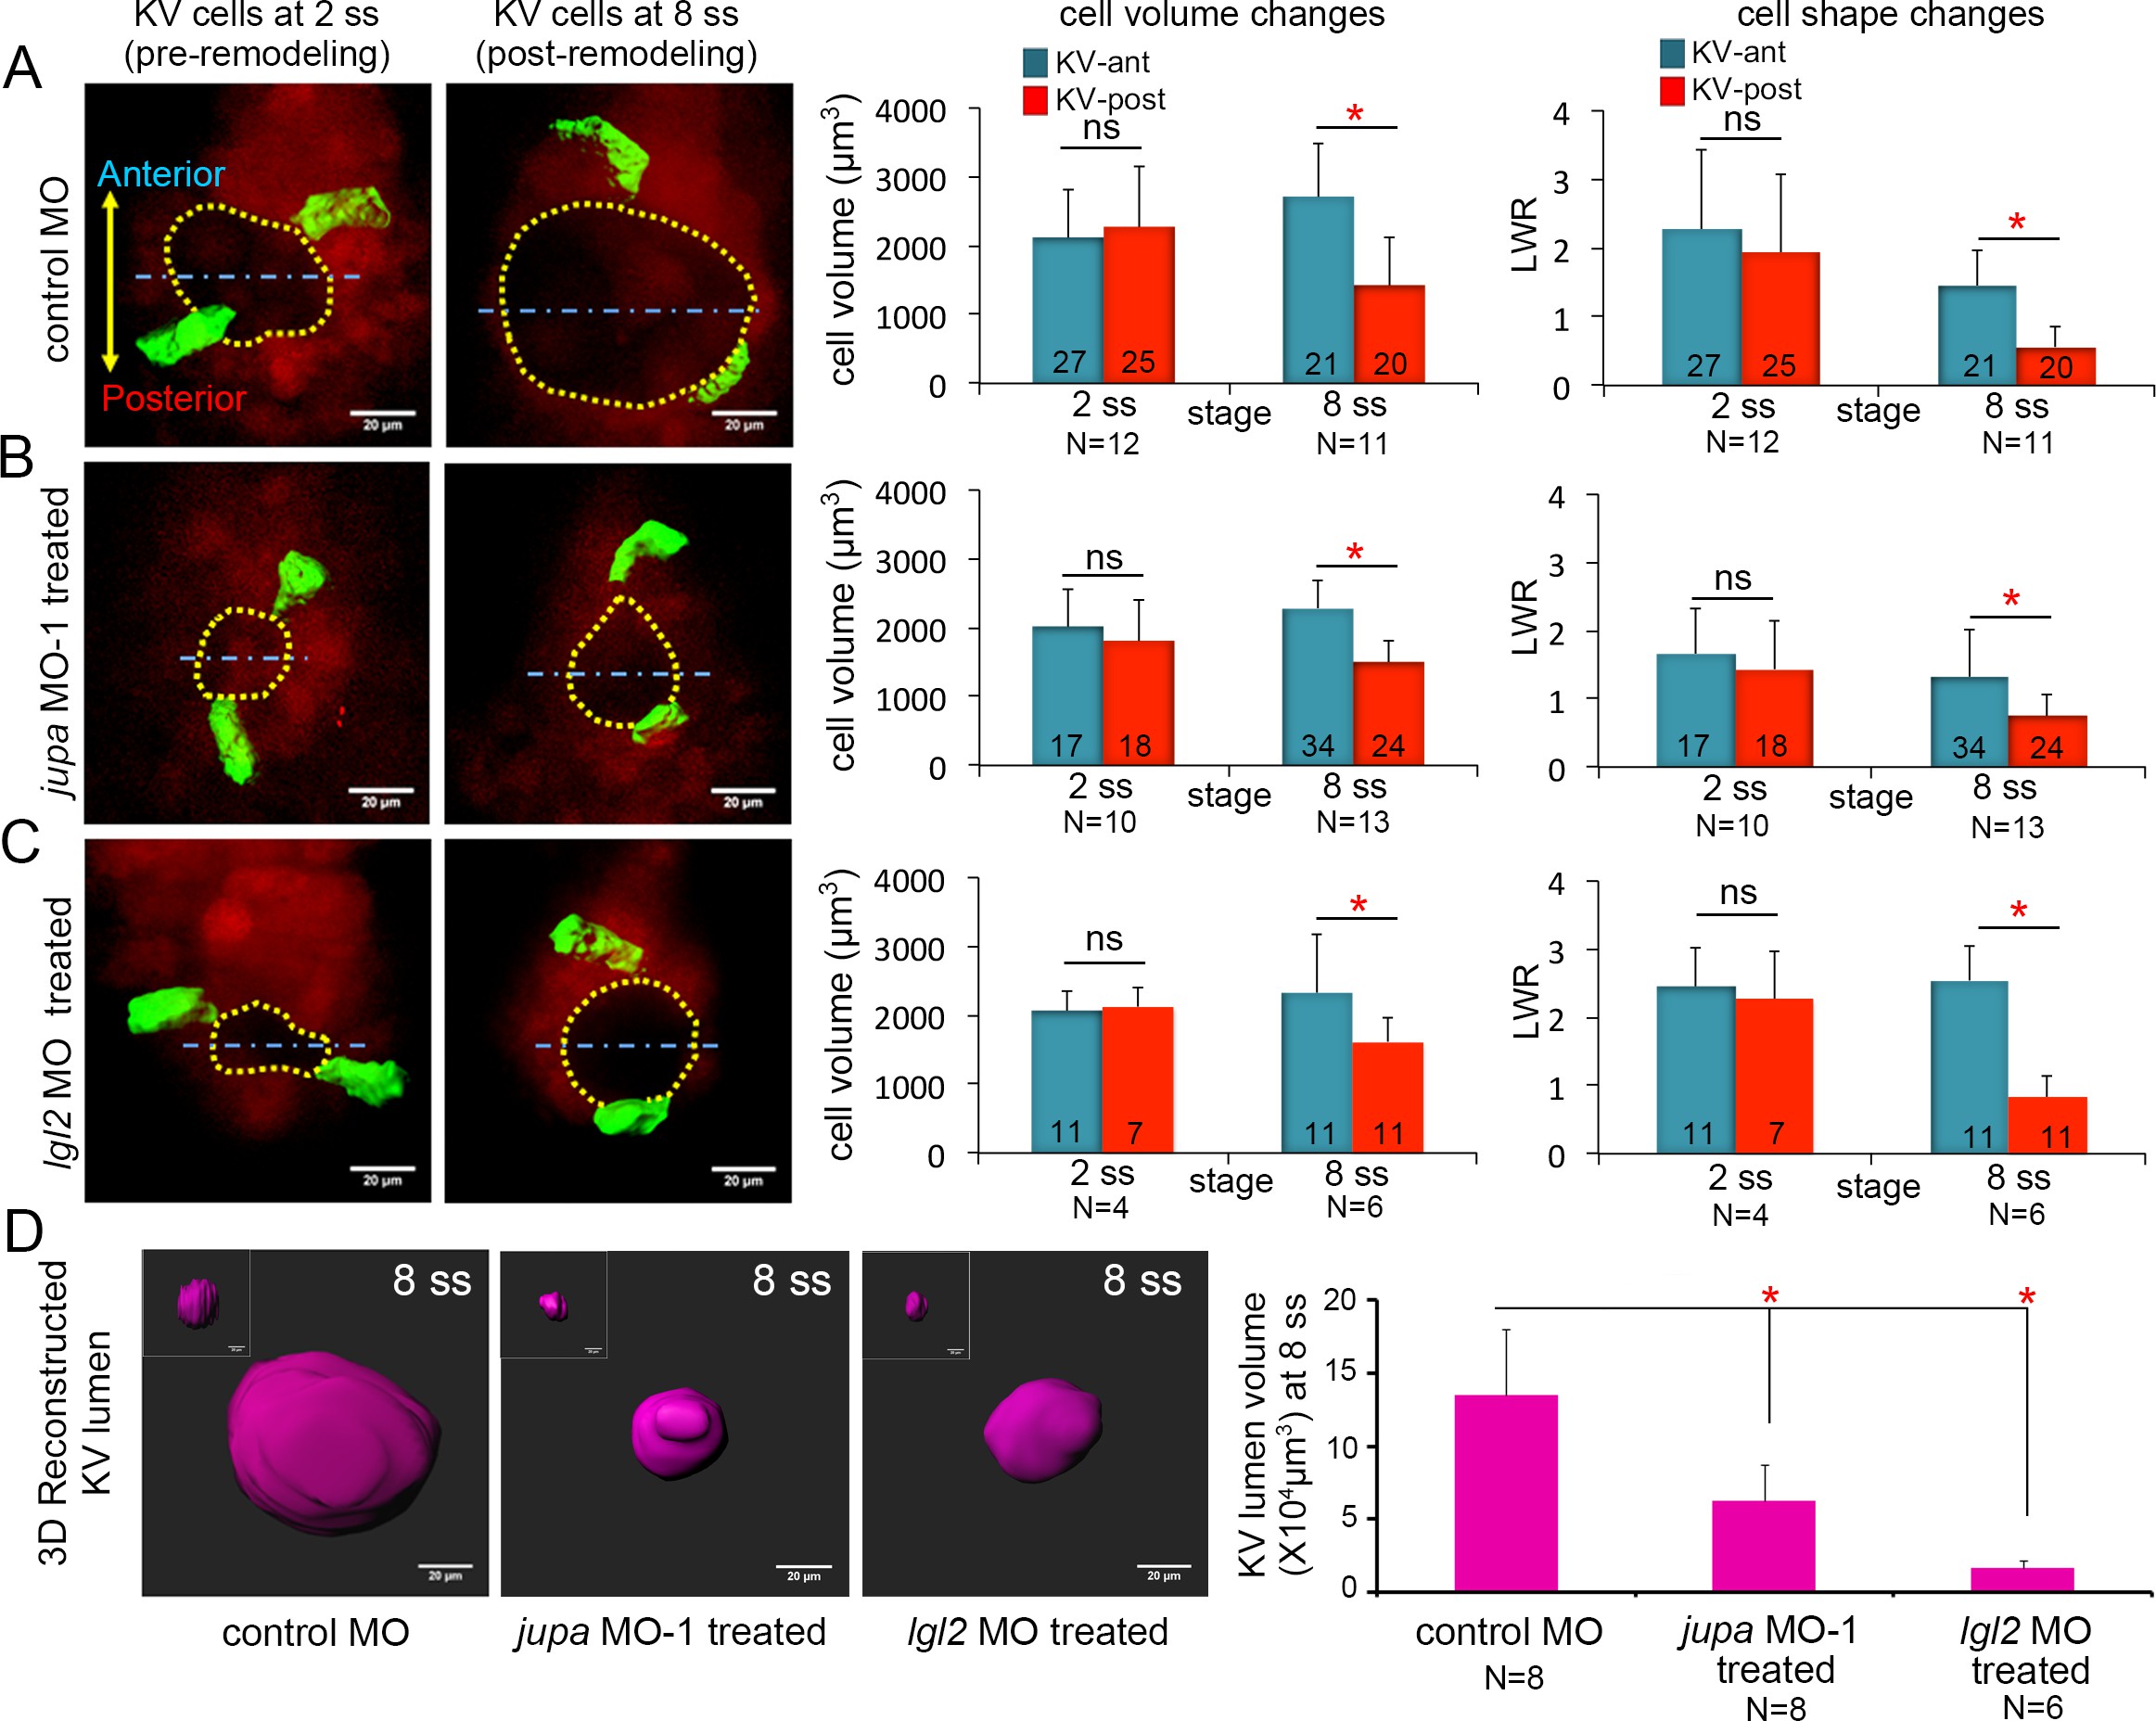
Asymmetric cell shape changes in KV are separable from lumen expansion.
(A) Mosaic labeled KV cells in control MO injected embryos showed asymmetric changes in cell volumes and cell shapes between at 2 ss and 8 ss. (B–C) Perturbing cell-cell junction integrity in KV by interfering with jupa (B) or lgl2 (C) expression inhibited KV lumen expansion, but asymmetric cell volume changes occurred that were similar to controls. In addition, asymmetric KV cell shape changes occurred normally in jupa and lgl2 MO embryos. (D) Quantification of 3D reconstructed KV lumen volumes (insets depict KV lumen in YZ axis) in control and treated live embryos at 8 ss. For quantitative analyses, the mean + SD is shown. The number of KV-ant and KV-post cells analyzed is indicated in the graphs in A-C. N = number of embryos analyzed. Data for control MO and jupa MO experiments are pooled from three independent experiments and lgl2 MO data are pooled from two experiments. Scale = 20 μm. *p<0.01 and ns = not significant (p>5% with Welch’s T-Test).