
|
Fig. 8
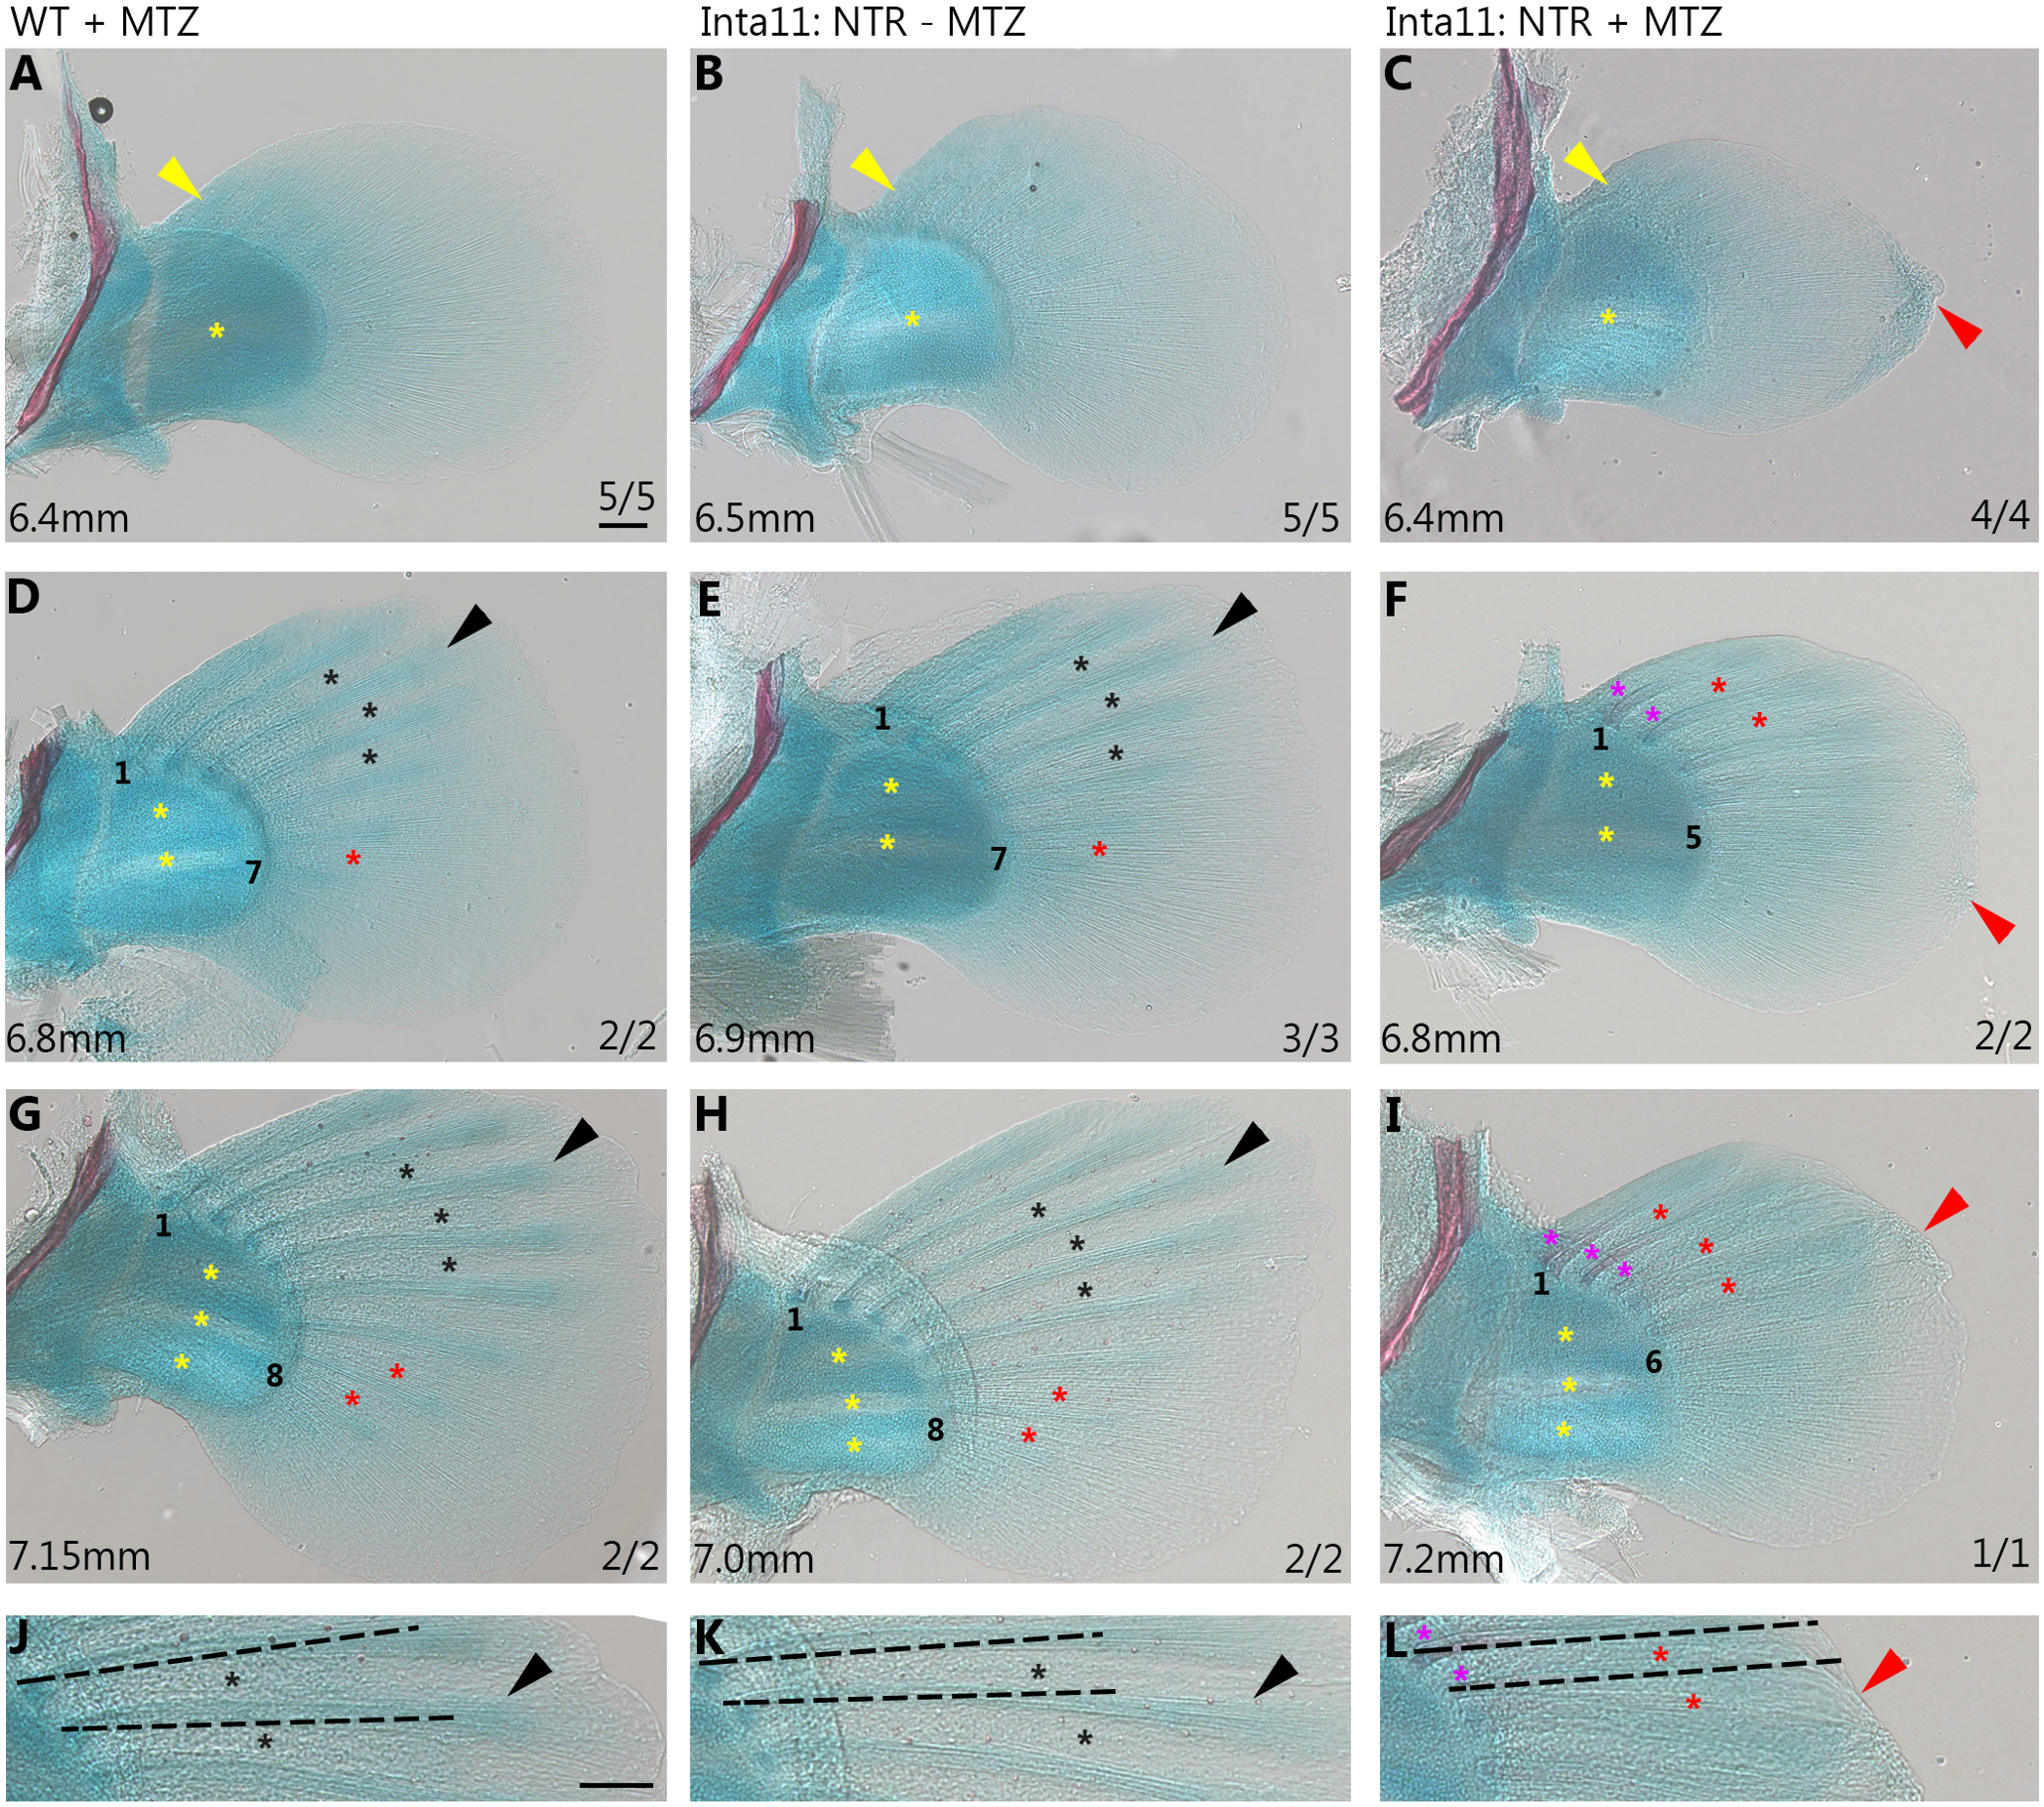
Actinotrichia defects, fin fold collapse, and fin ray defects in pectoral fins of Tg(Inta11:NTR) fish during late larval stages following metronidazole treatment.
(A-L) Cartilage and bone stained pectoral fins of WT-MTZ+DMSO, Inta11:NTR—MTZ, and Inta11: NTR + MTZ larvae at three standard lengths (6.4, 6.8, and 7.2mm). At standard length 6.4mm, Inta11: NTR + MTZ larvae continue to show fin fold collapse (red arrow), and actinotrichia disorganization (C), compared to control larvae (A-B). Decomposition of disc cartilage matrix between presumptive proximal radials 2 and 3 has started (yellow asterisks) (A-C). Note, the initial stages of anterior-most lepidotrichia formation are not affected in the Inta11: NTR + MTZ larvae (C), compared to control larvae (A-B) (yellow arrows). At standard lengths 6.8mm and 7.2mm, Inta11: NTR + MTZ larvae have a reduced number of visible lepidotrichia compared to control larvae (D-I). Anterior-most and posterior-most visible rays have been numbered. Inta11: NTR + MTZ larvae continue to have minor collapse of the fin fold (red arrows) (F, I, L). Control larvae have clearly defined interray zones (black asterisks) and distal ray regions (black arrow) (D-E, G-H, J-K). Inta11: NTR + MTZ larvae have poorly defined interray zones (red asterisks) (F, I, L) similar to less developed rays in control larvae (red asterisks) (D-E, G-H) and the distal tips of the fin rays are nearly indiscriminate from the surrounding regions of the fin fold (F, I, L). Inta11: NTR + MTZ larvae show premature proximal fin ray calcification (purple asterisks) in the anterior rays (F, I, L) which is absent in control larvae (D-E, G-H, J-K). Estimate of fin ray length reduction highlighted with dotted line (J-L). As distal tip of fin rays are undefined in Inta11: NTR + MTZ, length measurements were not possible. Dotted lines span from proximal edge of fin ray to the distal edge of the fin fold at fin rays 2, and 3 (L). Identical length lines are then superimposed over control fin rays 2 and 3 (J, K) to show discrepancy in length. Disc matrix decomposition has started between presumptive proximal radials 1 and 2 (yellow asterisks) (D-F) at 6.8mm in length, and presumptive proximal radials 3 and 4 (yellow asterisks) at 7.2mm in length (G-I). All Inta11: NTR + MTZ larvae are 30dpf, and staged matched control larvae were selected based on three different staging criteria (standard length, spinal cord/rib calcification progress, and stages of endoskeletal disc cartilage matrix decomposition). Scale bars: 100μm in A-L.