
|
Fig. 2
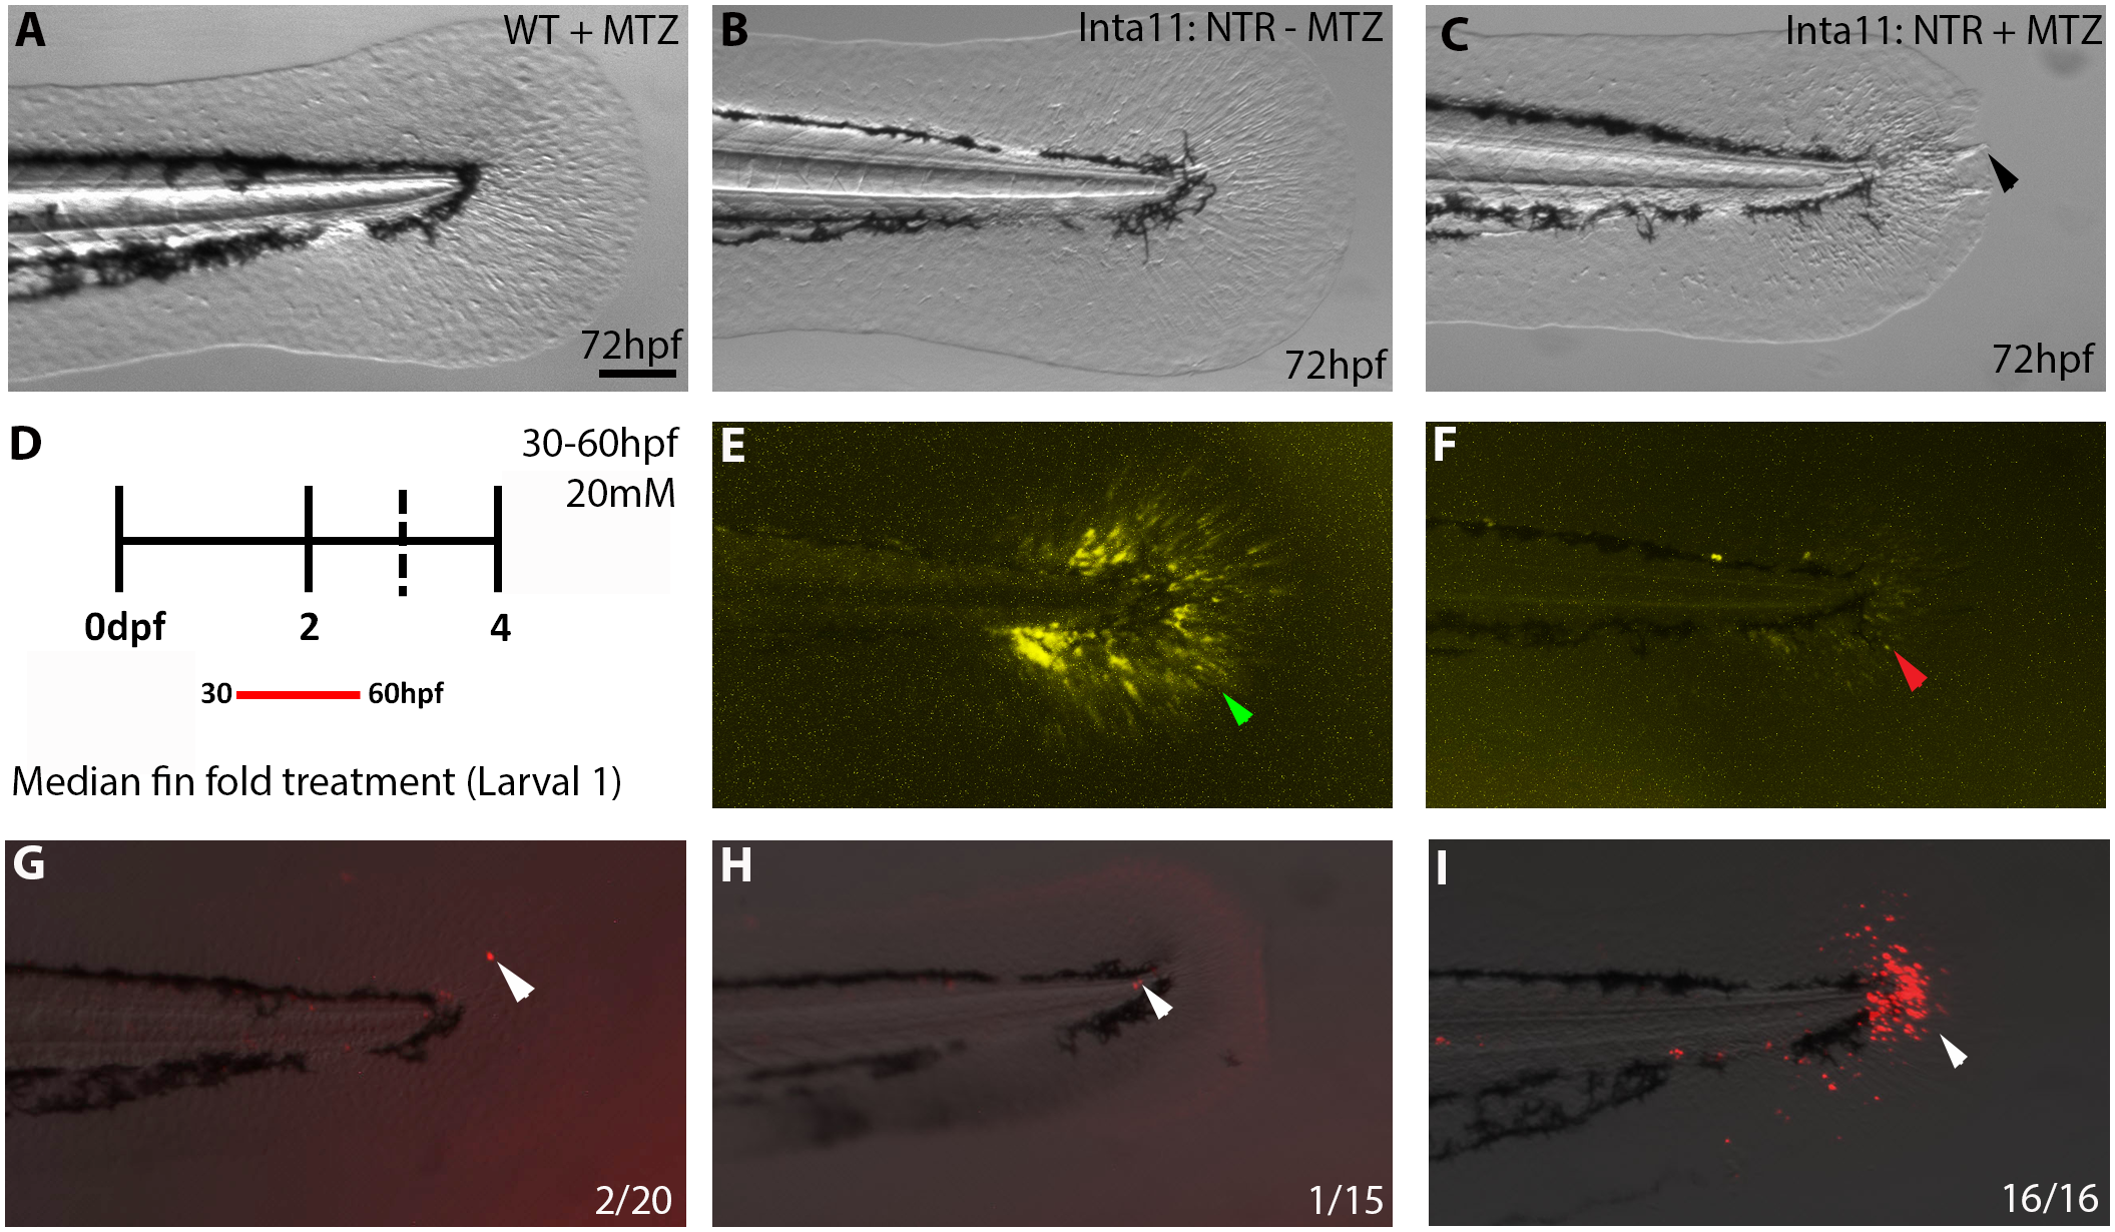
Subset of hoxa13a/hoxd13a-expressing cells specifically ablated in Tg(Inta11:NTR)fish following metronidazole treatment.
(A-C, E-I) Median fin fold of 72hpf larvae from 3 treatment groups (2 control, 1 experimental), YFP expression levels and TUNEL assay are shown. (D) Schematic of “Larval 1” treatment, larvae are exposed from 30-60hpf. Median fin morphology unaffected in treatment control groups (WT + MTZ, Inta11: NTR—MTZ) (A, B) compared to Inta11: NTR + MTZ (C). Inat11: NTR + MTZ larvae show median fin fold collapse (black arrow) (C). YFP expression drastically reduced in Inta11: NTR + MTZ larvae (red arrow) (F), when compared to Inta11: NTR—MTZ (green arrow) (E). A small percentage of treated control larvae (10% and 6.66%) display single TUNEL-positive cells in the median fin fold (white arrow) (G, H). All treated Inta11: NTR + MTZ larvae (n = 16) show TUNEL-positive cells in the median fin fold (white arrow) (I). Brightfield (A—C), fluorescence (E, F), and brightfield/fluorescence merged images (G-I). Scale bars: 100μm in A-C, E-I.