
|
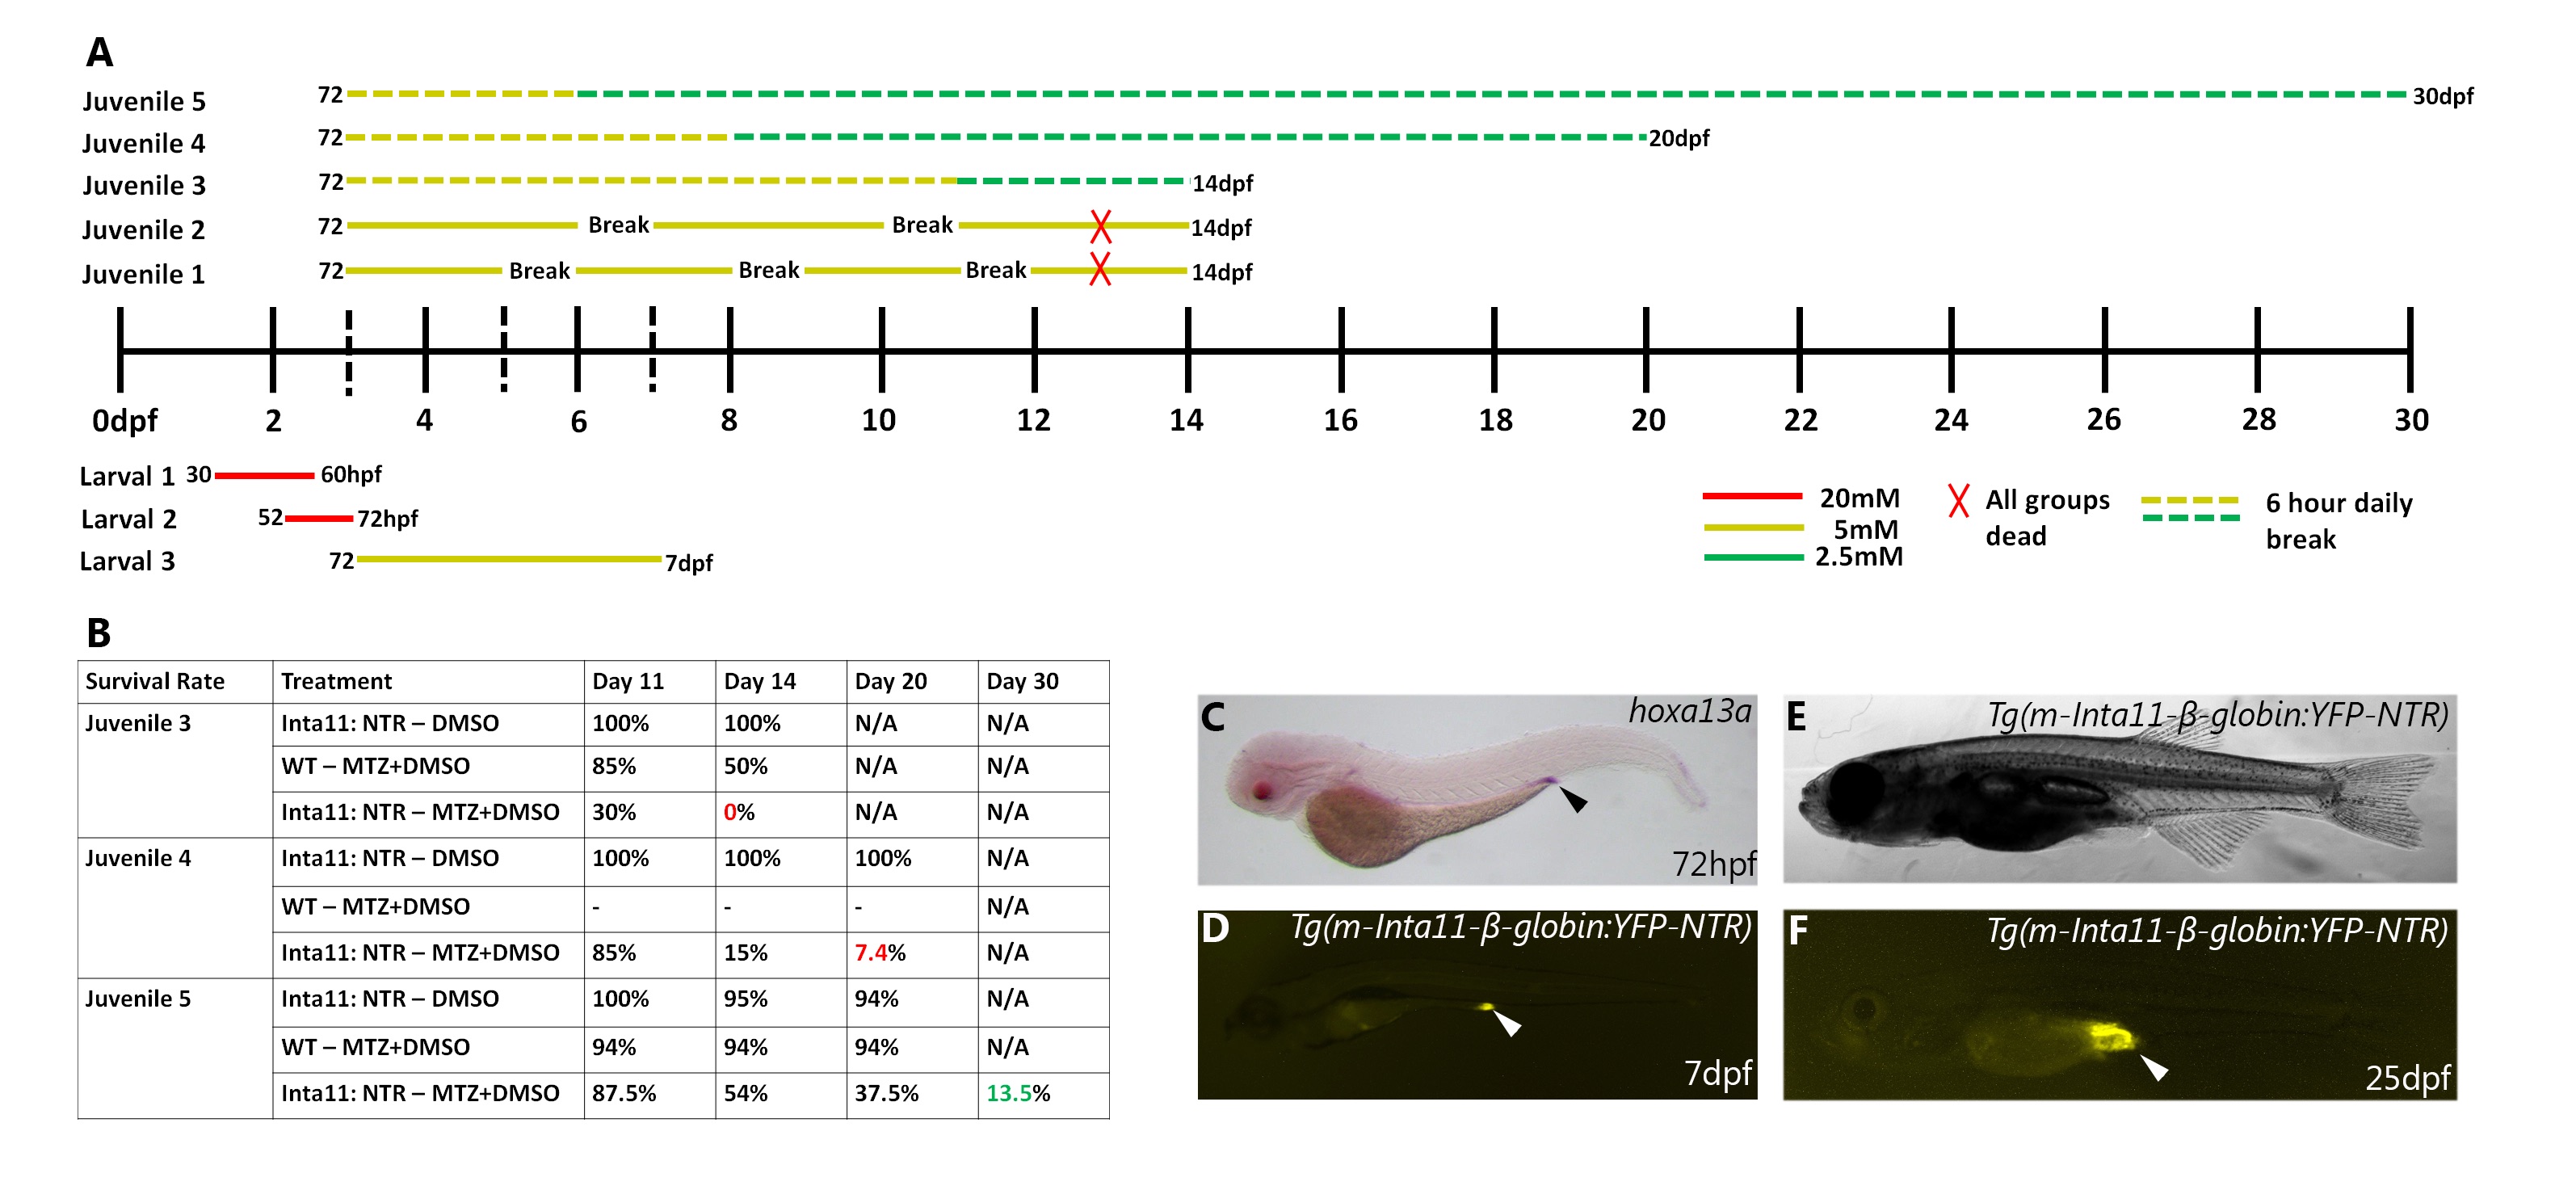
Fig. S1
Schematic of larval and juvenile treatments, including survival rate of “juvenile 3–5” treatments.
(A-B) All metronidazole treatments tested, including survival rates in “juvenile 3–5” treatments. (C) Secondary expression pattern of hoxa13a, YFP-NTR in digestive tract. “Larval 1–3” treatments used for all stats in Fig 6 (A). “Juvenile 1–2” treatments resulted in completely lethality at 13dpf of all treatment groups (A). “Juvenile 3–5” treatments included 6-hour daily breaks (A), however only “juvenile 5” treatment resulted in some Inta11: NTR + MTZ survival (13.5%) by 30dpf (B). WT + MTZ and Inta11: NTR—MTZ showed no difference in survival rate at 20dpf using “juvenile 5” treatment (B), and larvae were not raised to 30 dpf as they developed faster than Inta11: NTR + MTZ. Secondary expression pattern of NTR in digestive tract at 7dpf (white arrow) (D), consistent with hoxa13a expression during early larval development (black arrow) (C). Digestive tract YFP-NTR expression maintained throughout late larval development (25dpf) (white arrow) (E-F). Brightfield (C, E), fluorescence (D, F).