
Image
|
Figure Caption
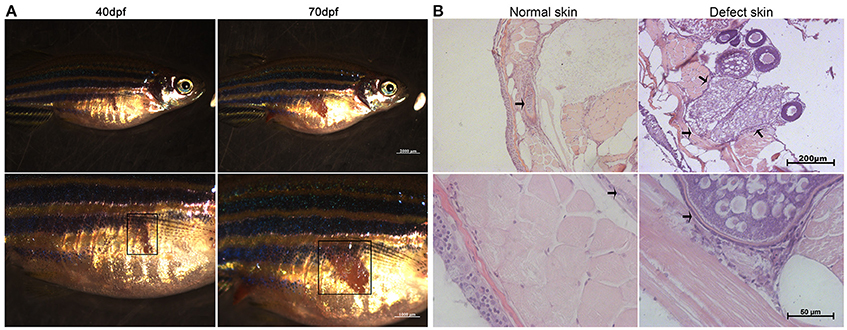
Fig. 2
A skin developmental defect of the female F1 generation of TFD zebrafish. (A) The phenotypes of the F1 generation showed different sizes developmental defect. Scale bars, 2,000 and 1,000 μm. Black boxes represent the region of defect skin. (B) The normal and defect skin from the same F1 TFD fish. The patch and defect tissue adherent to the ovary were marked by square or arrows. Scale bars, 200 and 50 μm.
Acknowledgments
This image is the copyrighted work of the attributed author or publisher, and
ZFIN has permission only to display this image to its users.
Additional permissions should be obtained from the applicable author or publisher of the image.
Full text @ Front. Physiol.