
|
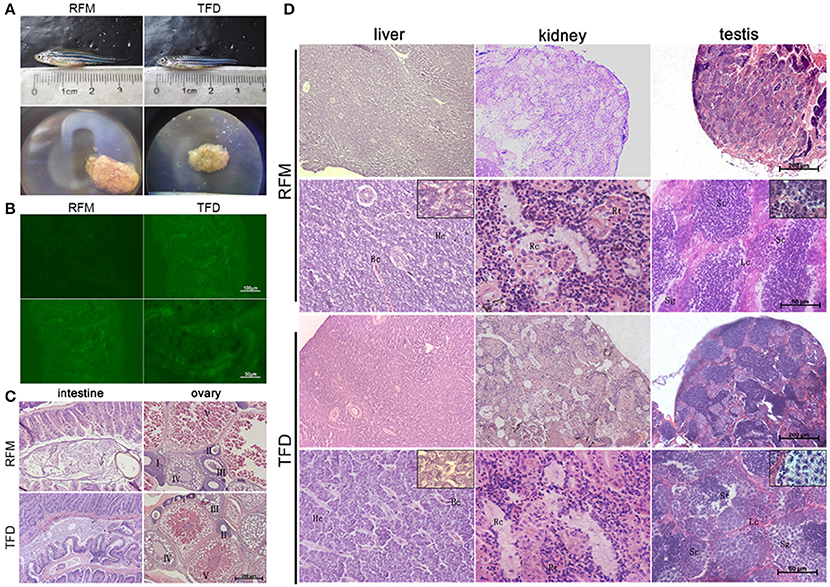
Fig. 1
The comparisons of different characteristics between the TFD and control RFM group. (A) The adult fish of two groups had similar body length. The gonad size of TFD fish was smaller than to the control one. (B) The intestine cells of two groups didn't express GFP. Scale bars, 100 and 50 μm. (C,D) Histological analyses of the intestine, liver, kidney, ovary, and testis between the TFD and RFM group. I-V mean the 5 phases of oocytes, respectively. Hc, Hepatic cell; Bc, Blood capillary; Rt, Renal tubular; Rc, Renal capsule; Sg, Spermatogonia; Sc, Spermatocyte; St, Spermatid; Lc, Leydig cell; Scale bars, 200 and 50 μm.