
Image
|
Figure Caption
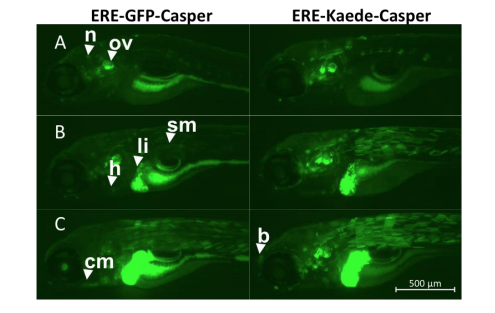
Fig. S2
Comparison of ERE-GFP-Casper and ERE-Kaede-Casper models. Sensitivity and tissue response of the two models were compared via imaging after 0-5 dpf exposures to embryo water (A), 5 ng/L EE2 (B) and 10 ng/L EE2 (C). All images were acquired by inverted compound microscope (Zeiss Axio Observer) using a 5x objective. Images are presented with the GFP filter only.
Acknowledgments
This image is the copyrighted work of the attributed author or publisher, and
ZFIN has permission only to display this image to its users.
Additional permissions should be obtained from the applicable author or publisher of the image.
Full text @ Sci. Rep.