
|
Fig. S9
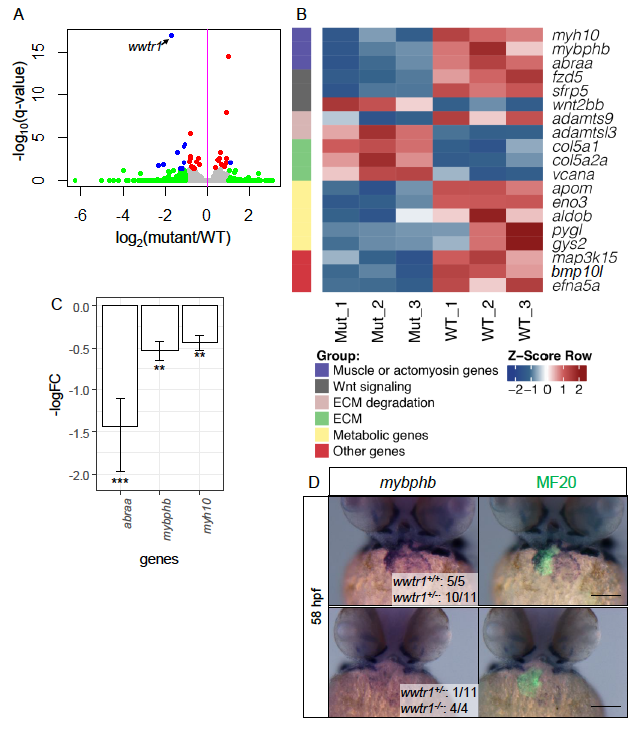
Transcriptomic analyses of wwtr1-/- hearts compared to wwtr1+/+ hearts at 57- 59 hpf. (A) Volcano plot comparing the transcriptomes of wwtr1-/- to wwtr1+/+ sibling hearts collected at 57 – 59 hpf. As expected, wwtr1 is significantly downregulated in wwtr1-/- hearts. Each point represents a gene. Blue points are genes that are significantly differentially expressed; red points are genes that are moderately differentially expressed; green points are genes not significantly differentially expressed (see Materials and Methods for thresholds). (B) Heat map of z-scores of selected significantly differentially expressed genes assigned to functional categories. (C) Significantly differentially expressed genes that regulate muscle maturation and actin dynamics. Error bars are one unit of standard deviation from three RNAseq biological replicates of each genotype. ** - adjusted P < 0.01; *** - adjusted P < 0.001 calculated by DESEQ2. (D) Whole mount in situ hybridization for mybphb expression counterstained with MF20 reveals cardiac-specific loss of mybphb expression in wwtr1-/- hearts.