
Fig. S3
- ID
- ZDB-IMAGE-180608-16
- Publication
- Lai et al., 2018 - The Hippo pathway effector Wwtr1 regulates cardiac wall maturation in zebrafish
- All Figures
- Figures for Lai et al., 2018
|
Fig. S3
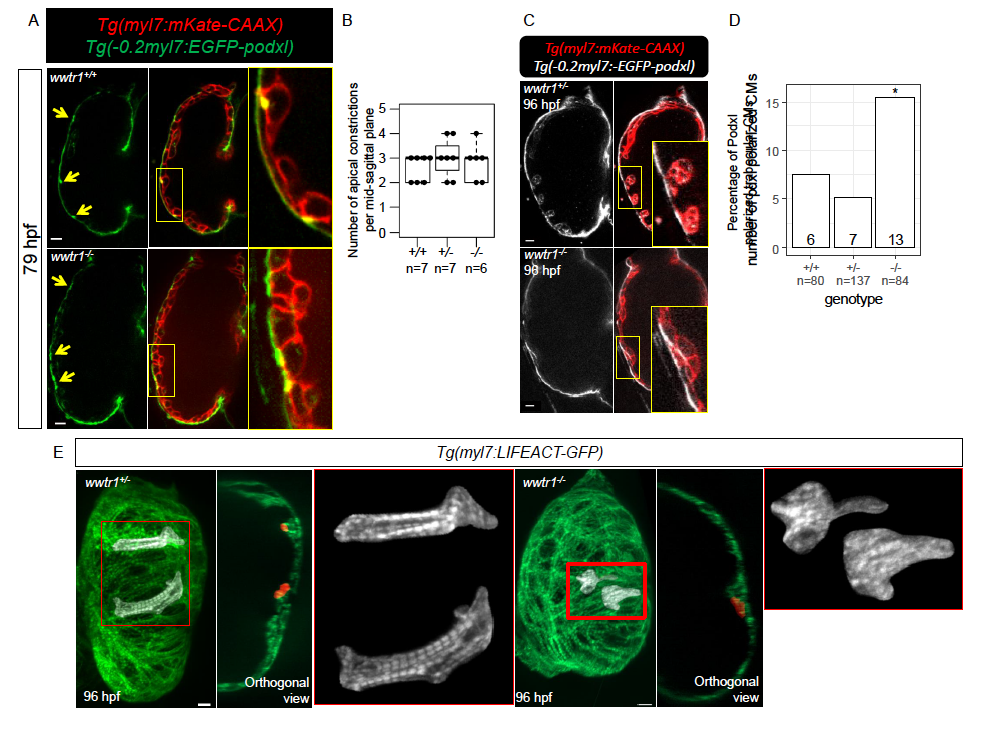
Number of cardiomyocytes undergoing apical constriction and morphology of trabecular cardiomyocytes. (A) Confocal mid-sagittal sections of 79 hpf hearts showing cardiomyocytes undergoing apical constriction (yellow arrows). Scale bars, 10 μm. (B) Number of cardiomyocytes undergoing apical constriction. Each point represents a heart. (C) Confocal mid-sagittal sections of 96 hpf hearts showing distribution of EGFP-Podxl in cardiomyocytes. Scale bars, 10 μm. (D) Percentage and number of EGFP-Podxl-polarized trabecular cardiomyocytes. ‘n’ number of trabecular cardiomyocytes were assessed from 8 wwtr1+/+, 10 wwtr1+/-, and 9 wwtr1-/- hearts. * - P < 0.05 by exact Binomial test. (E) Maximum projections of 96 hpf hearts. Clusters of trabecular cardiomyocytes (myl7:mKate+) were selected to extract the LIFEACT-GFP channel (shown in insets). Selected clusters of trabecular cardiomyocytes are marked in red in the orthogonal views. 3/3 trabecular cardiomyocytes from 2 wwtr1+/? hearts exhibit tubular morphology and striated cortical actin, and 4/4 trabecular cardiomyocytes from 2 wwtr1-/- hearts exhibit flattened morphology and indistinct cortical actin. Scale bars, 10 μm.