
|
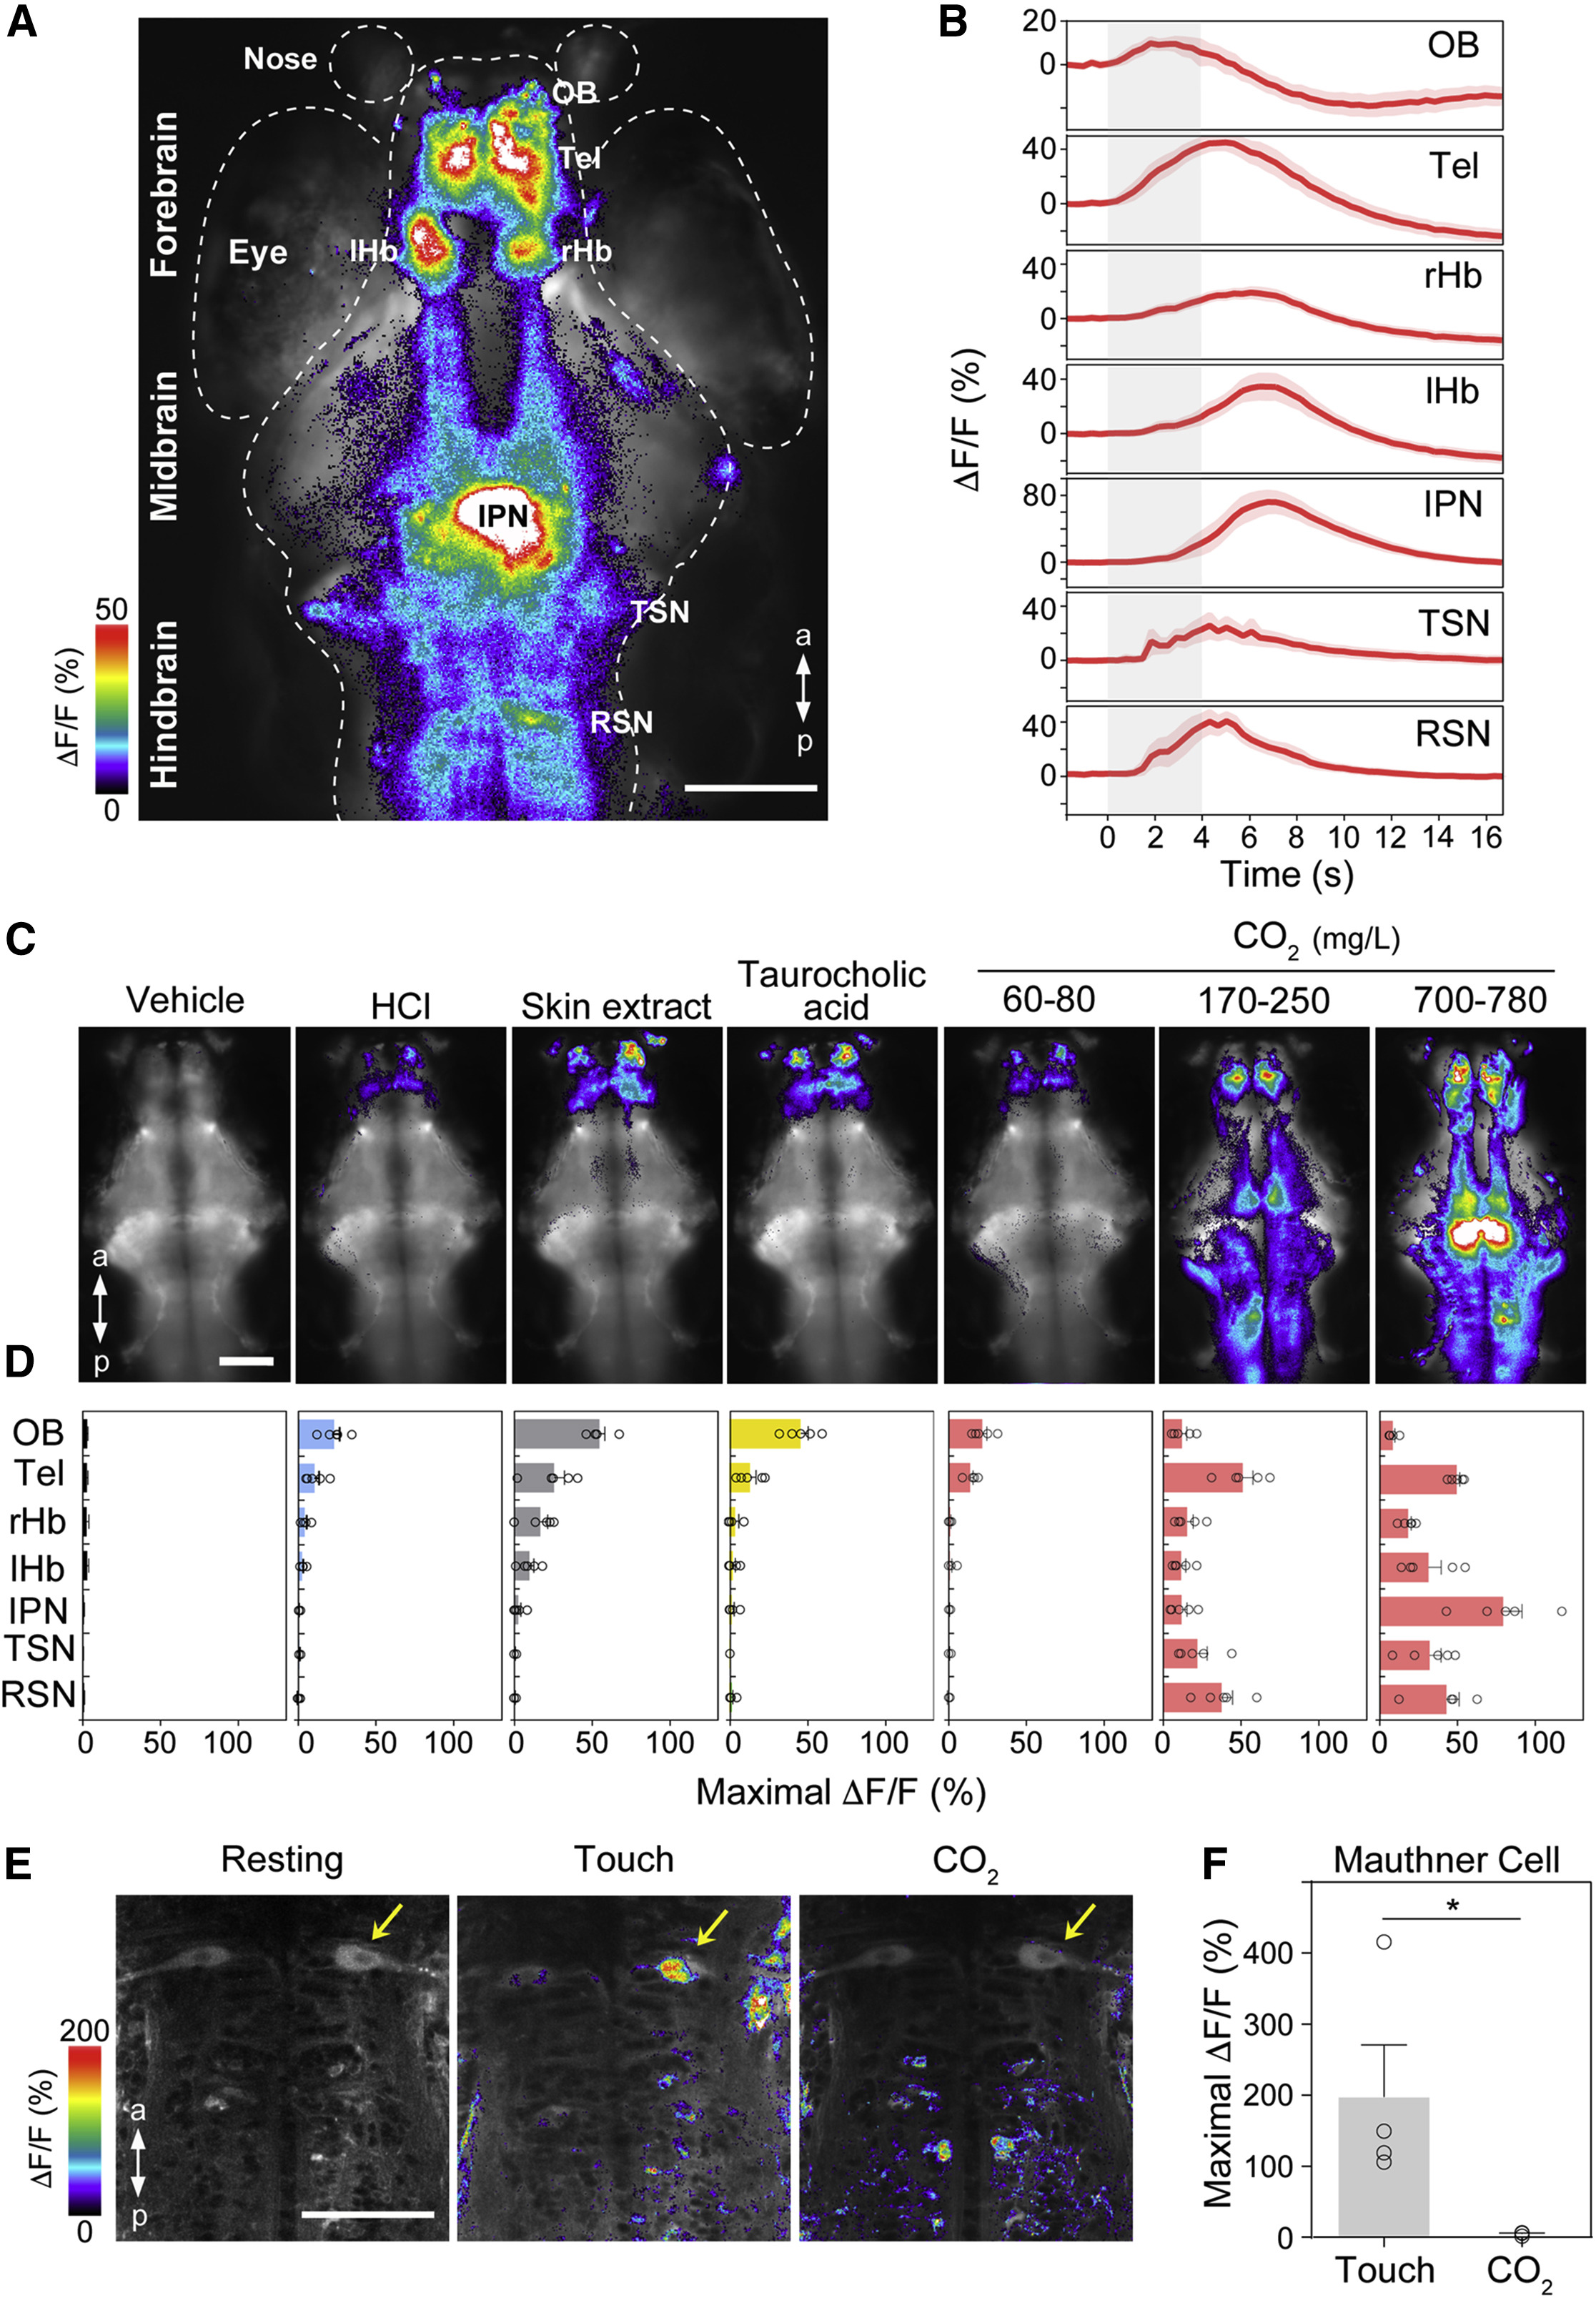
Fig. 2 CO2 Activates Ensembles of Neurons in Larval Zebrafish (A) Representative example of the maximal intensity projection of the Ca2+ increase from wide-field Ca2+ imaging upon CO2 stimulation in Tg(Huc:Gal4;UAS:GCaMP5) fish. OB, olfactory bulb; Tel, telencephalon; rHb, right habenula; lHb, left habenula; IPN, interpeduncular nucleus; TSNs, trigeminal sensory nuclei; RSNs, reticulospinal neurons. White dotted lines outline brain, eye, and nose. Scale bar, 100 μm. (B) Temporal dynamics of GCaMP5 fluorescence (ΔF/F) evoked by CO2 in individual brain areas. Mean ΔF/F (solid line) and SEM (transparency) (n = 8). Gray-shaded areas indicate the period of CO2 application (4 s). (C) Representative examples of wide-field Ca2+ imaging from a single fish stimulated with vehicle control, HCl (1 mM), skin extract, taurocholic acid (1 mM), and CO2 (60–80, 170–250, and 700–780 mg/L). Scale bar, 100 μm. (D) Bar graphs showing the maximal ΔF/F evoked by chemical stimuli in various brain regions. Vehicle control (black), HCl (blue), skin extract (gray), taurocholic acid (yellow), and CO2 (red). Values represent mean ± SEM (n = 5). (E) Representative examples of two-photon Ca2+ imaging in the Mauthner cells from a single fish before (left) or after (middle) touch stimulation and CO2 stimulation (right, 700–780 mg/L) in Tg(Huc:Gal4;hspGFF62A;UAS:G-CaMP7) fish. Scale bar, 100 μm. Arrows indicate the right Mauthner cell. (F) Bar graph showing the maximal ΔF/F evoked by touch and CO2 stimuli in the Mauthner cells. Values represent mean ± SEM (n = 4). Unpaired t test; ∗p < 0.05. See also Figure S2 and Movie S6.