
Fig. 7
- ID
- ZDB-IMAGE-180524-19
- Publication
- Sánchez-Iranzo et al., 2018 - Tbx5a lineage tracing shows cardiomyocyte plasticity during zebrafish heart regeneration
- All Figures
- Figures for Sánchez-Iranzo et al., 2018
|
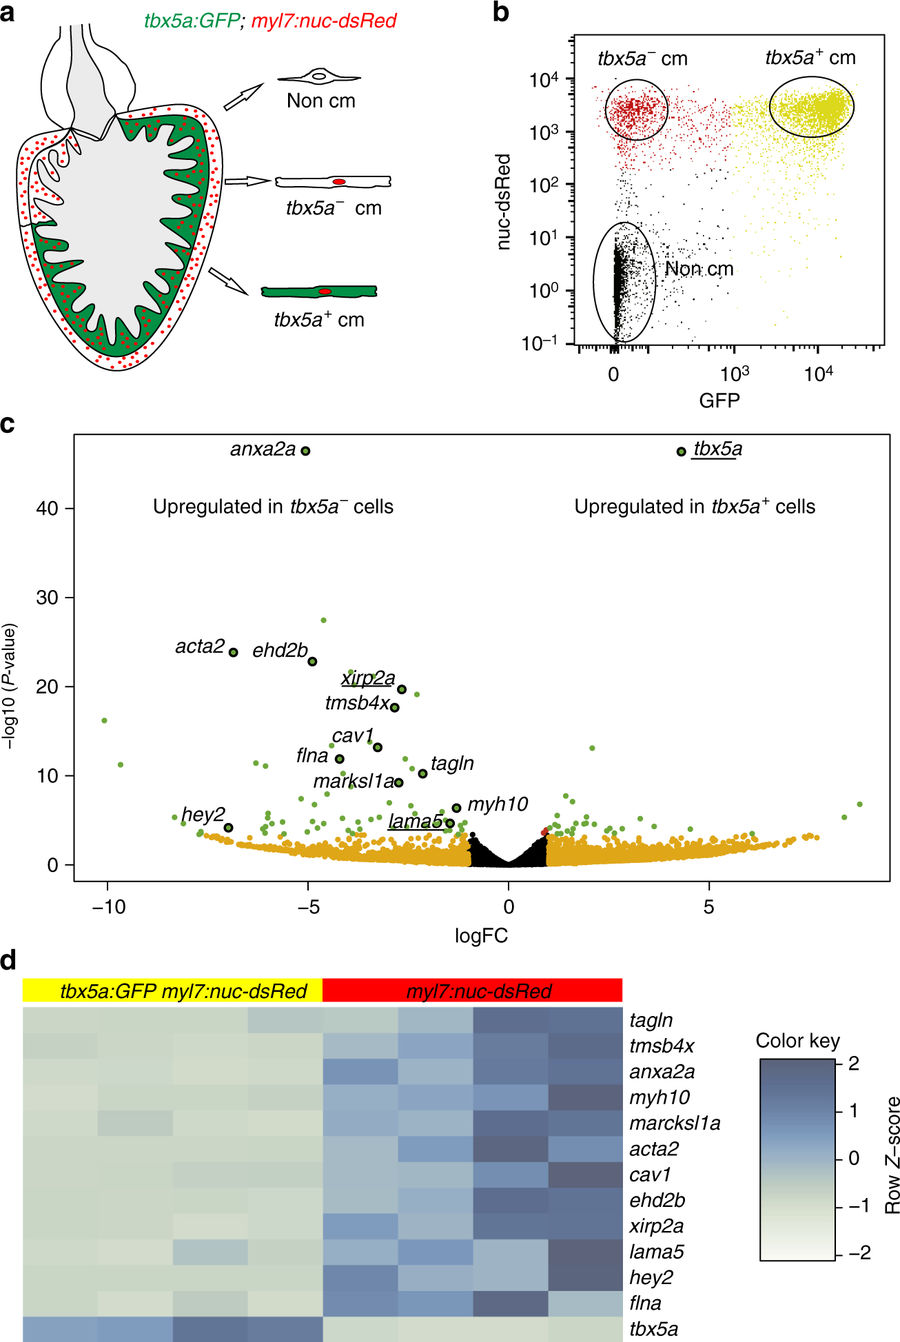
Fig. 7
tbx5a+ and tbx5a− cardiomyocytes from adult ventricles exhibit distinct expression profiles. a, b GFP+/nuc-dsRed+ and GFP−/nuc-dsRed+ cardiomyocytes were fluorescence-activated cell (FAC) sorted from adult tbx5a:GFP;myl7:nuc-dsRed ventricles (n = 5 pooled heart per replicate; four replicates in total). c Volcano plot representing RNA-seq results comparing both populations. Black, false discovery rate (FDR) > 0.05, log fold change (LFC) < 1; orange, FDR > 0.05, LFC > 1; red, FDR < 0.05, LFC < 1; green, FDR < 0.05, LFC > 1. d Heatmap of genes differentially expressed in tbx5a+ and tbx5a– cardiomyocytes from adult hearts. Dark blue, higher expression; light blue, lower expression. cm, cardiomyocytes