
IMAGE
Fig. S4
- ID
- ZDB-IMAGE-180516-2
- Publication
- Gagnon et al., 2017 - The primary role of zebrafish nanog is in extra-embryonic tissue.
- All Figures
- Figures for Gagnon et al., 2017
Image
|
Figure Caption
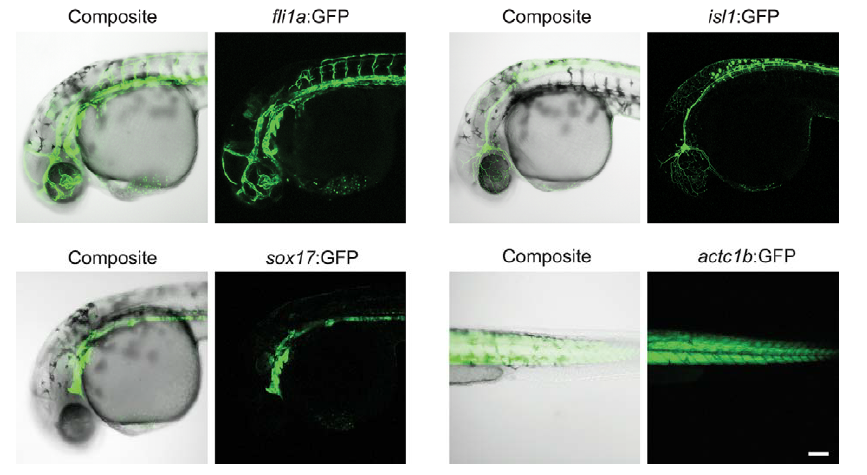
Fig. S4
Transgene expression in wild-type embryos. For comparison with transplanted cells in Figure 6D, representative wild-type transgene expression patterns are shown at 30 hpf, imaged and processed as in Figure 6D. Scale bar indicates 100 microns.
Acknowledgments
This image is the copyrighted work of the attributed author or publisher, and
ZFIN has permission only to display this image to its users.
Additional permissions should be obtained from the applicable author or publisher of the image.
Full text @ Development