
IMAGE
Fig. S2
- ID
- ZDB-IMAGE-180511-53
- Publication
- Wu et al., 2018 - Glucose-6-phosphate dehydrogenase is indispensable in embryonic development by modulation of epithelial-mesenchymal transition via the NOX/Smad3/miR-200b axis
- All Figures
- Figures for Wu et al., 2018
Image
|
Figure Caption
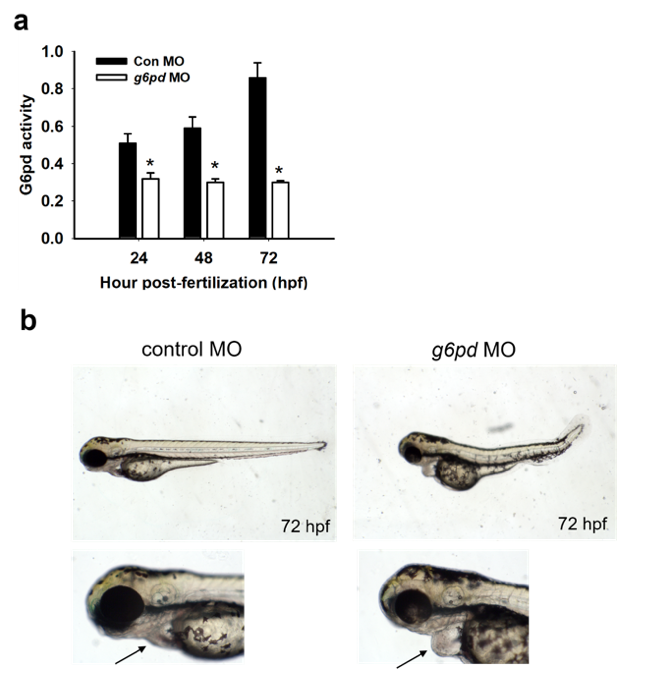
Fig. S2
The kinetics of G6pd activity at 24, 48, and 72 h postfertilization (hpf) are shown. (a)The kinetic data of control MO revealed that G6pd activity was increased during zebrafish embryonic development. However, g6pd MO injection reduced G6pd activity. (b) Cardiac edema was observed in the g6pd morphants (as indicated by the arrowhead).
Figure Data
Acknowledgments
This image is the copyrighted work of the attributed author or publisher, and
ZFIN has permission only to display this image to its users.
Additional permissions should be obtained from the applicable author or publisher of the image.
Full text @ Cell Death Dis.