
Fig. S4
- ID
- ZDB-IMAGE-180510-22
- Publication
- Theisen et al., 2018 - Neurotransmitter-mediated activity spatially controls neuronal migration in the zebrafish cerebellum
- All Figures
- Figures for Theisen et al., 2018
|
Fig. S4
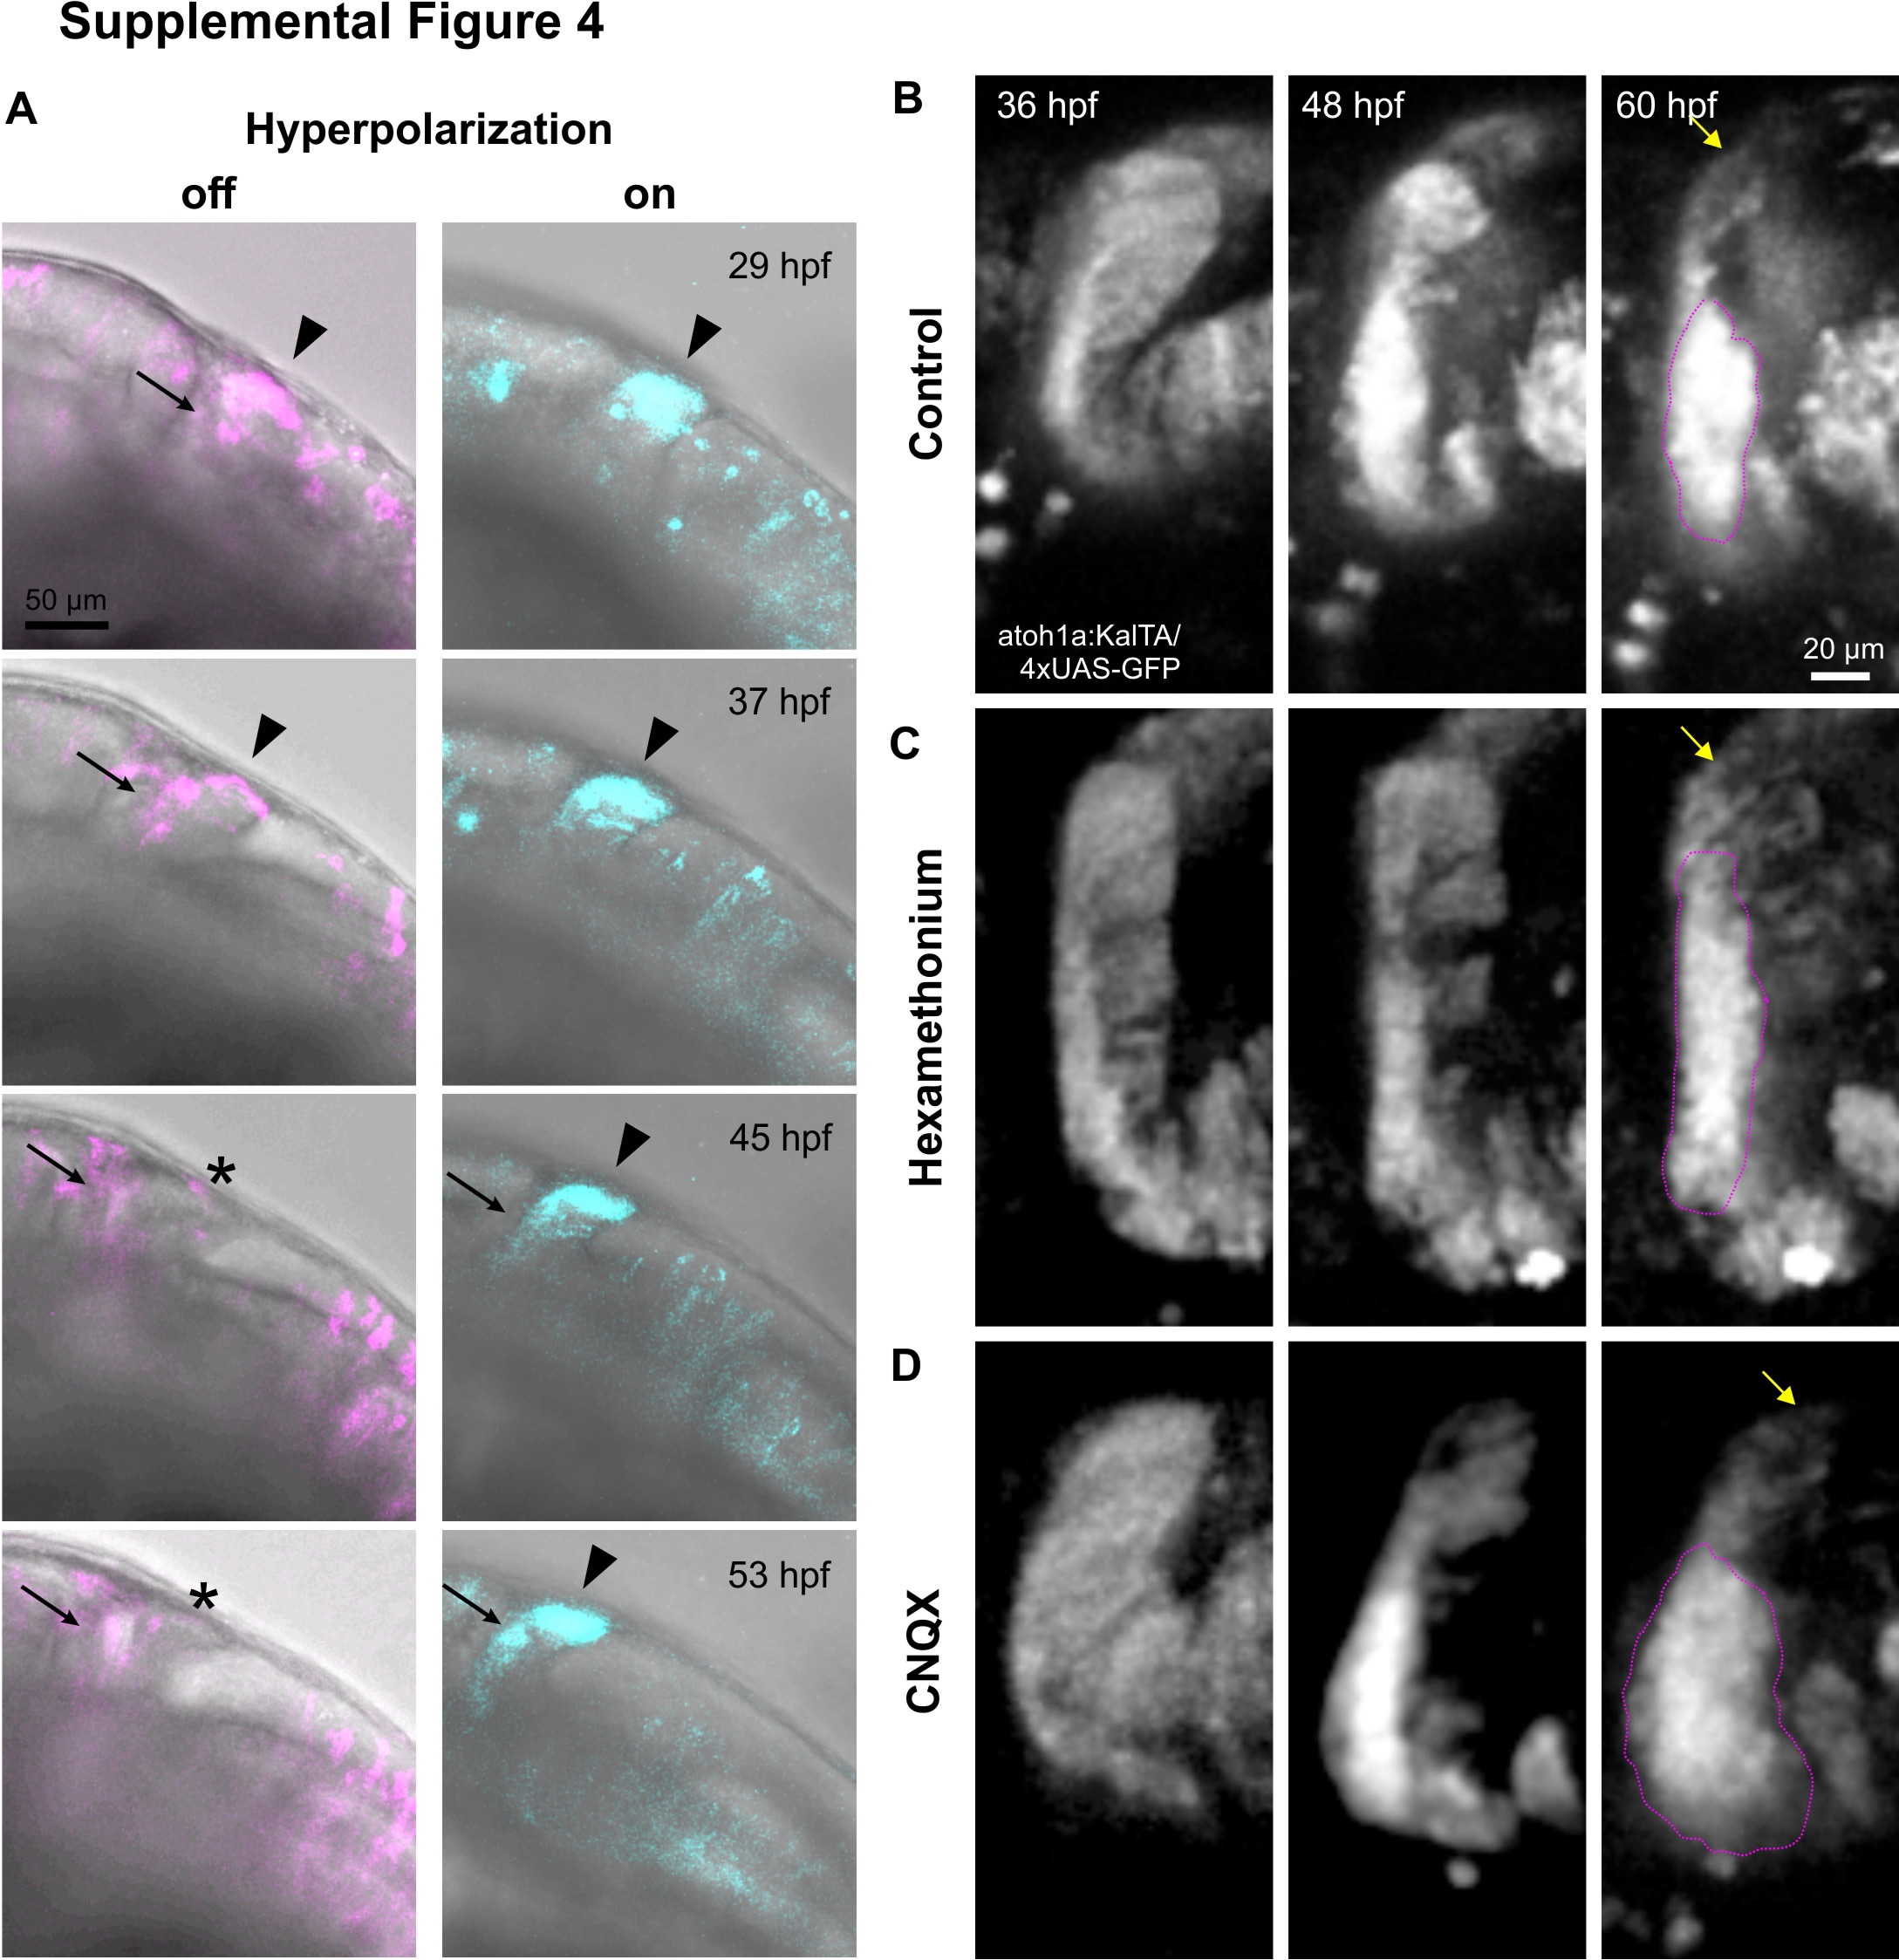
(A) Fluorescent images are overlaid on transmitted light images to show tissue development and delayed THN migration progress in prolonged hyperpolarization. Arrowheads indicate the starting points, arrows point to the THNs’ progress. Stars indicate the original starting point after THNs have left the region. Developmental stages are indicated. Scale bar: 100 μm. See also S6 Video. (B) Magnified cerebellar region from images of control THNs shown in Fig 1B. THNs emerge from the URL, then follow the MHB to form a cluster at the ventral end of the MHB, indicated by magenta line. Yellow arrow indicates the dorsal end of the cerebellum to facilitate the localization of THNs in the tissue. Developmental stages are indicated at the top. Scale bar: 20 μm. (C) Prolonged hexamethonium treatment leads to a delay in THN cluster formation as seen by the elongated distribution of THNs instead of a cluster (magenta outline). The arrow indicates the dorsal end of the cerebellum and THNs that are still distributed along the MHB. See also S15 Video. (D) Blocking AMPA receptors continuously with CNQX leads to premature aggregation of THNs near the ventral region of the cerebellum. Note the size and shape of the cluster at 60 hpf (outlined in magenta) compared to control in (B). Arrow denotes the dorsal end of the tissue. AMPA, α-amino-3-hydroxy-5-methyl-4-isoxazolepropionic acid receptor; CNQX, 6-cyano-7-nitroquinoxaline-2,3-dione; MHB, midbrain-hindbrain boundary; THN, tegmental hindbrain nuclei neuron; URL, upper rhombic lip.