
|
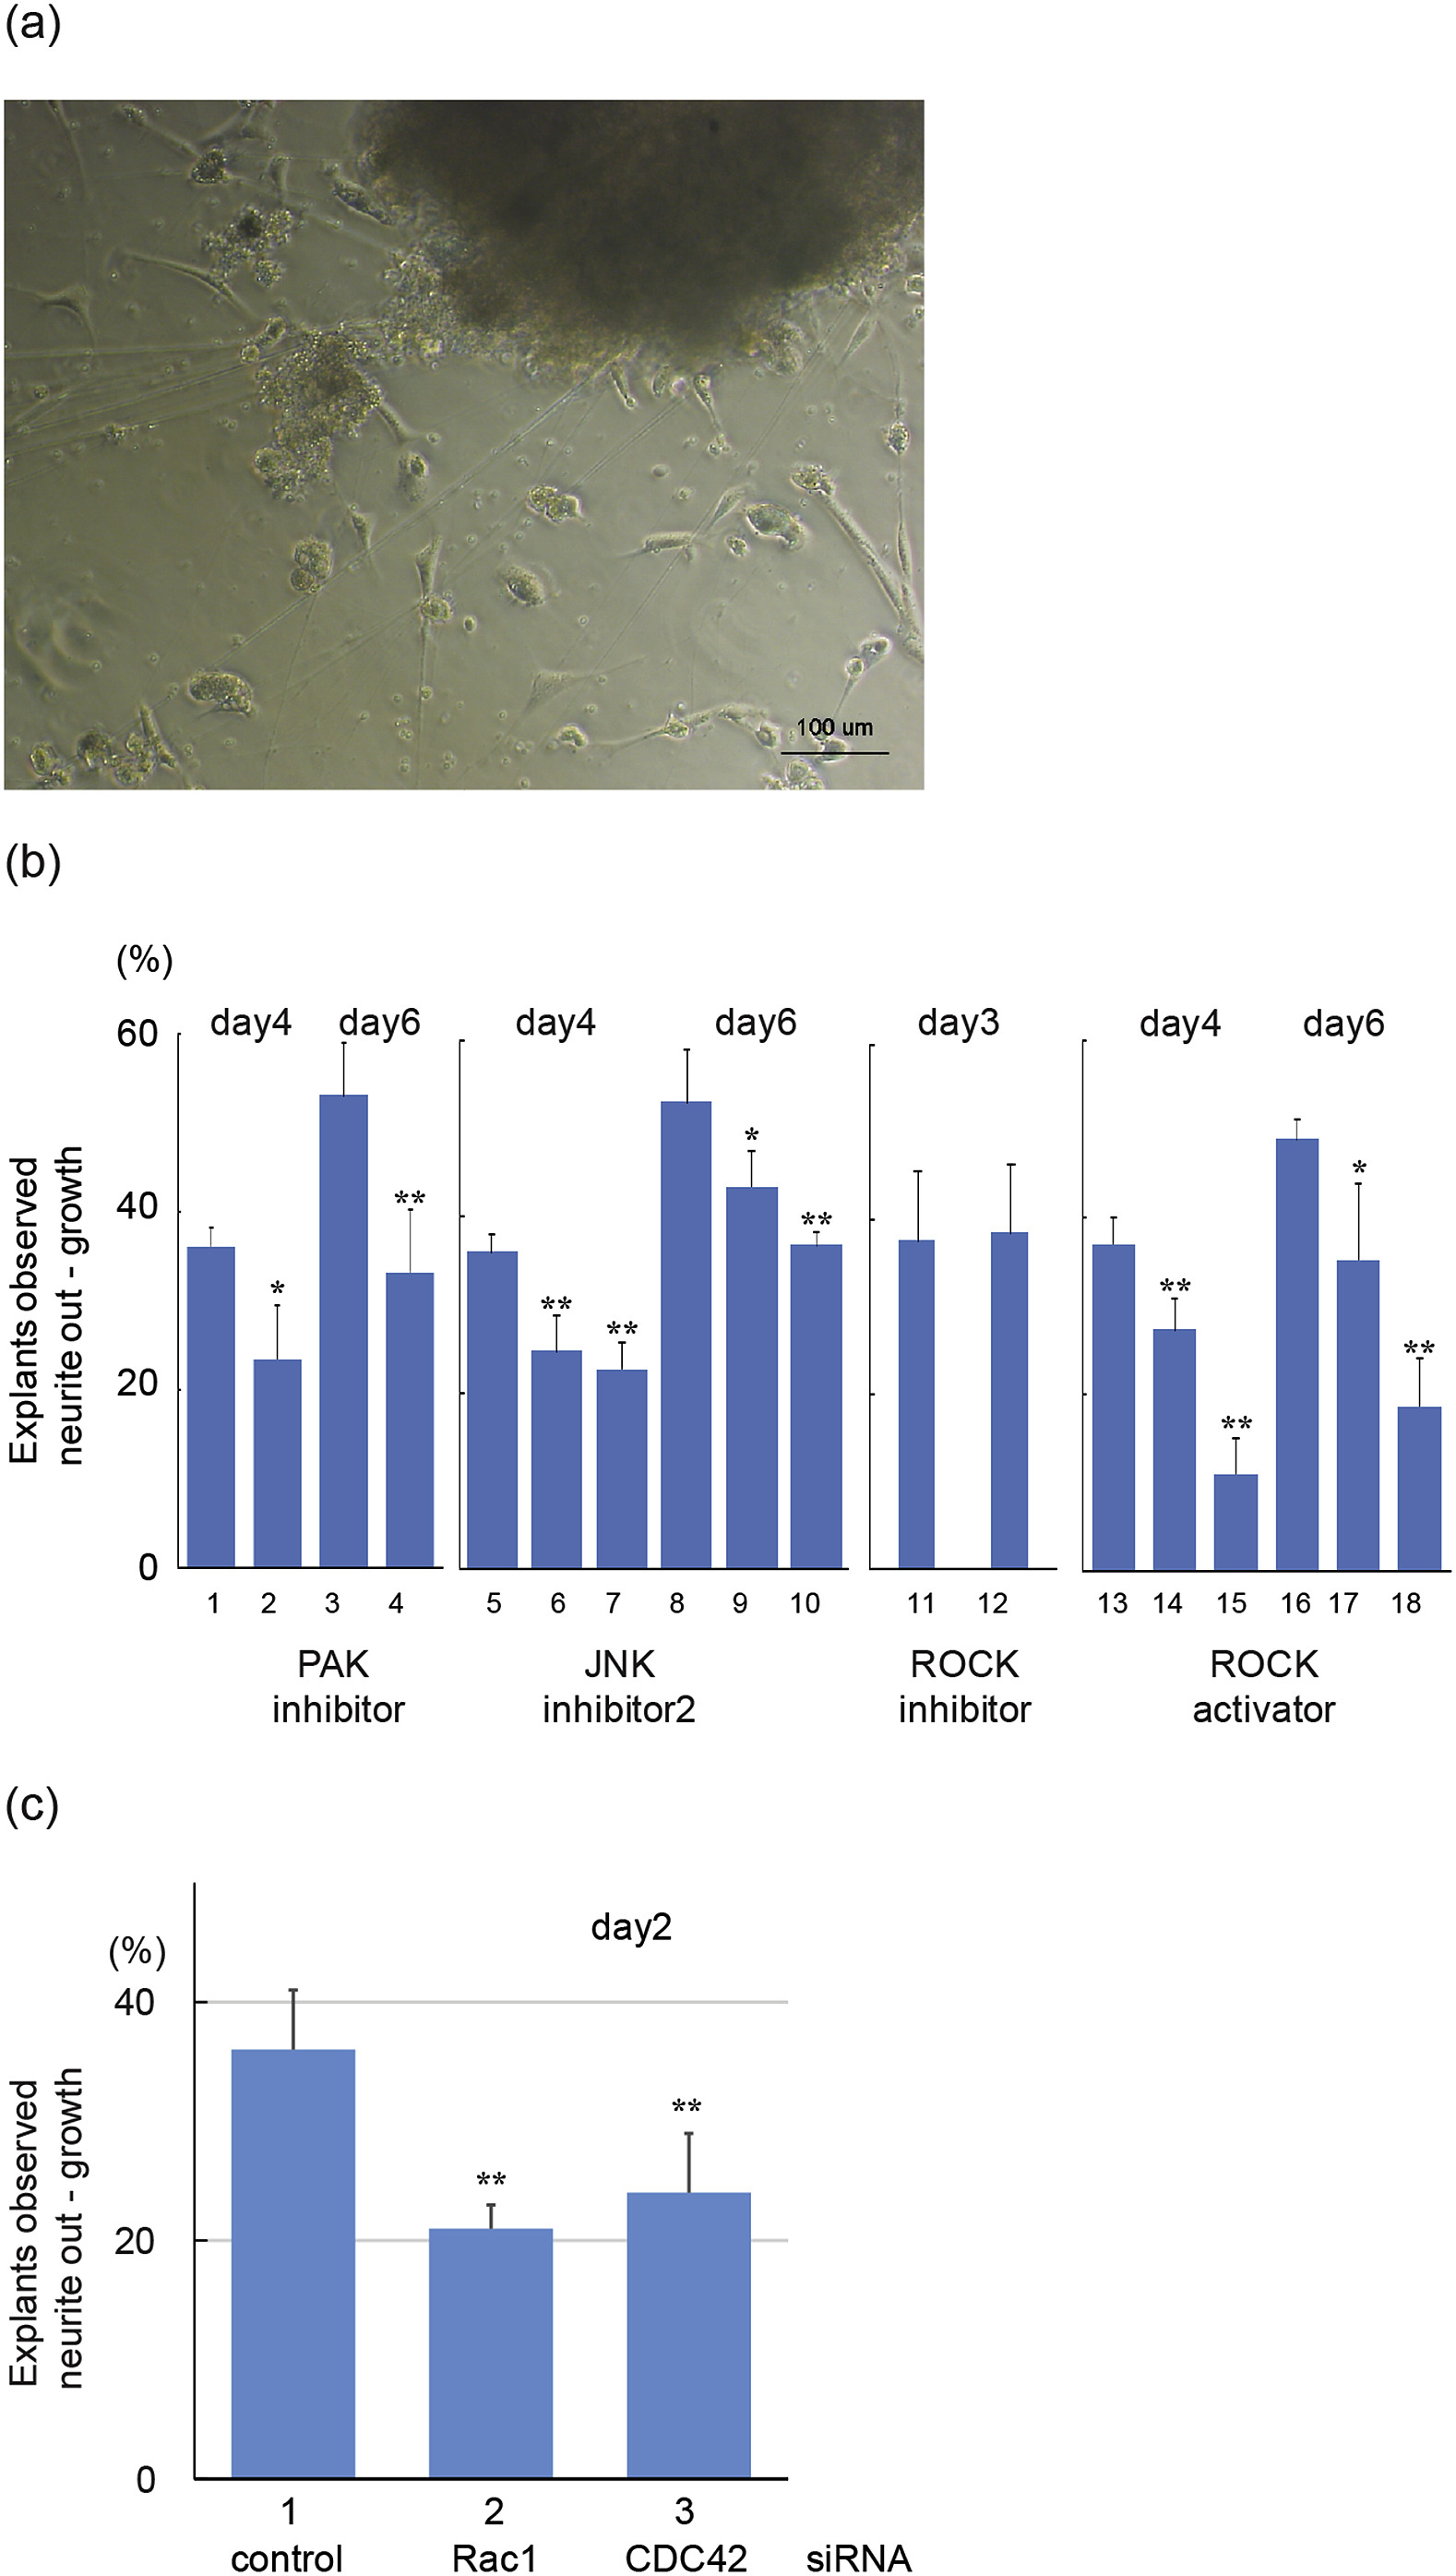
Fig. 1
(A) Neurite extension from zebrafish retinal explants. A retinal explant extending neurites is shown. Scale bar: 0.1 mm. (B) Neurite outgrowth from retinal explants under various conditions. Retinal explants were cultured for the number of days indicated. Each well received 1 mM IPA-3 (PAK inhibitor; columns 2 and 4), 0.1 μM JNK inhibitor II (columns 6 and 9), 0.5 μM JNK inhibitor II (columns 7 and 10), 3 nM H-1152 (ROCK inhibitor; column 12), 10 μg/mL (columns 14 and 17) or 30 μg/mL (columns 15 and 18) calpeptin (ROCK activator), or DMSO (columns 1, 3, 5, 8, 11, 13 and 16). Explants were cultured for 3, 4 or 6 days, as indicated. For clarity, control values are shown twice (columns 1 and 5 are the same and columns 3 and 8 are the same). Data are the means of four wells each, and the bars are the standard deviations. The ordinate: number of explants with observed neurite extension, expressed as a percentages of the total number of explants. *p < 0.05 or **p < 0.01, compared with control. (C) Neurite outgrowth from zebrafish retinal explants after treatment with Rac1 or CDC42 siRNA. Wells received control siRNA (column 1), Rac1 siRNA (column 2) or CDC42 siRNA (column 3). Wells were cultured for 2 days. The means were obtained from four wells. **p < 0.01, compared with control.