
|
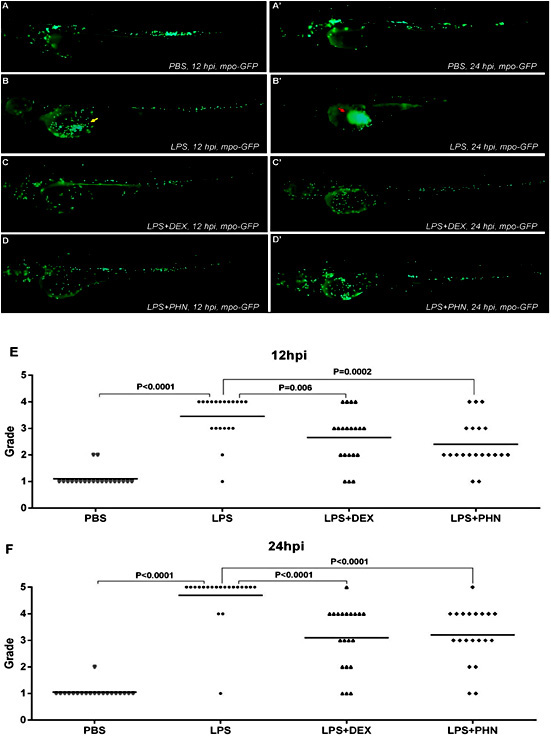
Fig. 3
PHN inhibits neutrophil recruitment and decreases the yolk necrosis induced by LPS; Tg (mpo:GFP) marks neutrophils (A-D’). Fluorescence imaging of 3-dpf Tg (mpo:GFP) live larvae (n = 20) at 12 hpi (A, B, C, D) and 24 hpi (A’, B’, C’, D’) using the GFP channel. The yellow arrow in B indicates the neutrophil, while the red arrow in B’ indicates yolk necrosis. The negative control was PBS (A/A’), and the positive control was 5 µg/ml DEX (C/C’). The LPS model group (B/B’) and the 10 µg/ml PHN treatment group (D/D’) are shown. E and F show the inflammatory grading scatter diagrams in each group at 12 and 24 hpi, respectively. Grade 1 = normal (zero or several leucocytes, no necrosis); Grade 2 = leucocytes scattered in the yolk, no necrosis; Grade 3 = leucocyte recruitment to the LPS site, no necrosis; Grade 4 = bulk infiltration of leucocytes and leucocyte adhesion, no necrosis; Grade 5 = yolk deformation and necrosis. The scatter diagrams represent data pooled from three independent experiments.