
|
Fig. 2
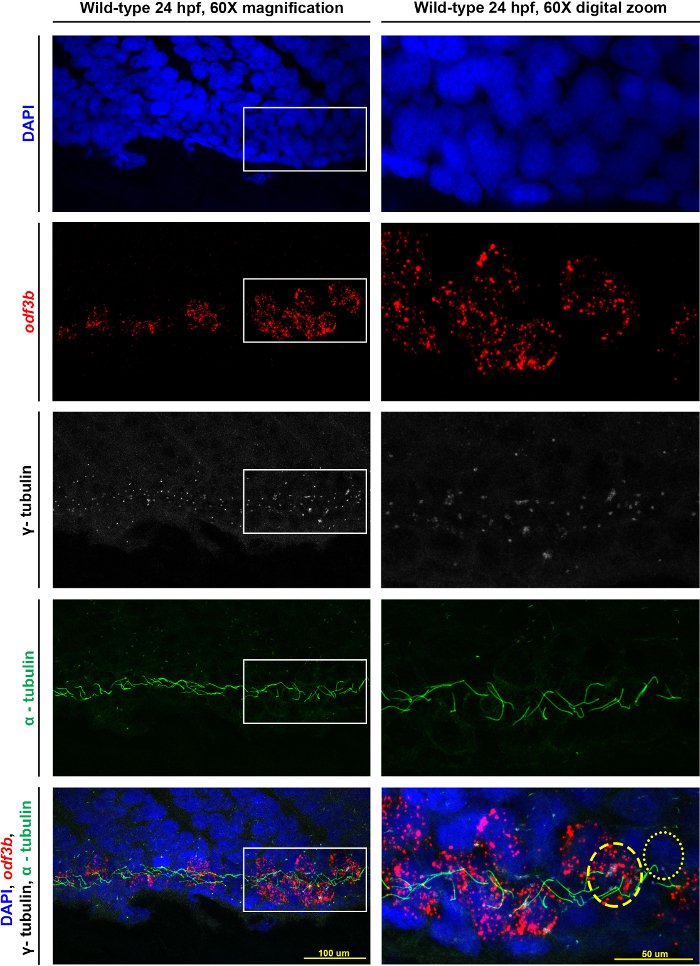
Representative results for visualizing MCCs of the zebrafish pronephros.
Maximum image projections of a 24 hpf wild-type zebrafish embryo at 60X magnification as well as a digital zoom on the confocal at 60X magnification of the same embryo. The white boxes indicate the area focused on for the zoom. Individual stains of DAPI (nuclei), odf3b (MCCs), γ-tubulin (basal bodies), and α-tubulin (cilia) are labeled and then merged together in the bottom two panels. In the digital zoom, we provide approximations of the cell locations as follows: an MCC is outlined by the dashed yellow circle, and the dotted yellow circle outlines a mono-ciliated cell.