
|
Fig. 1-S3
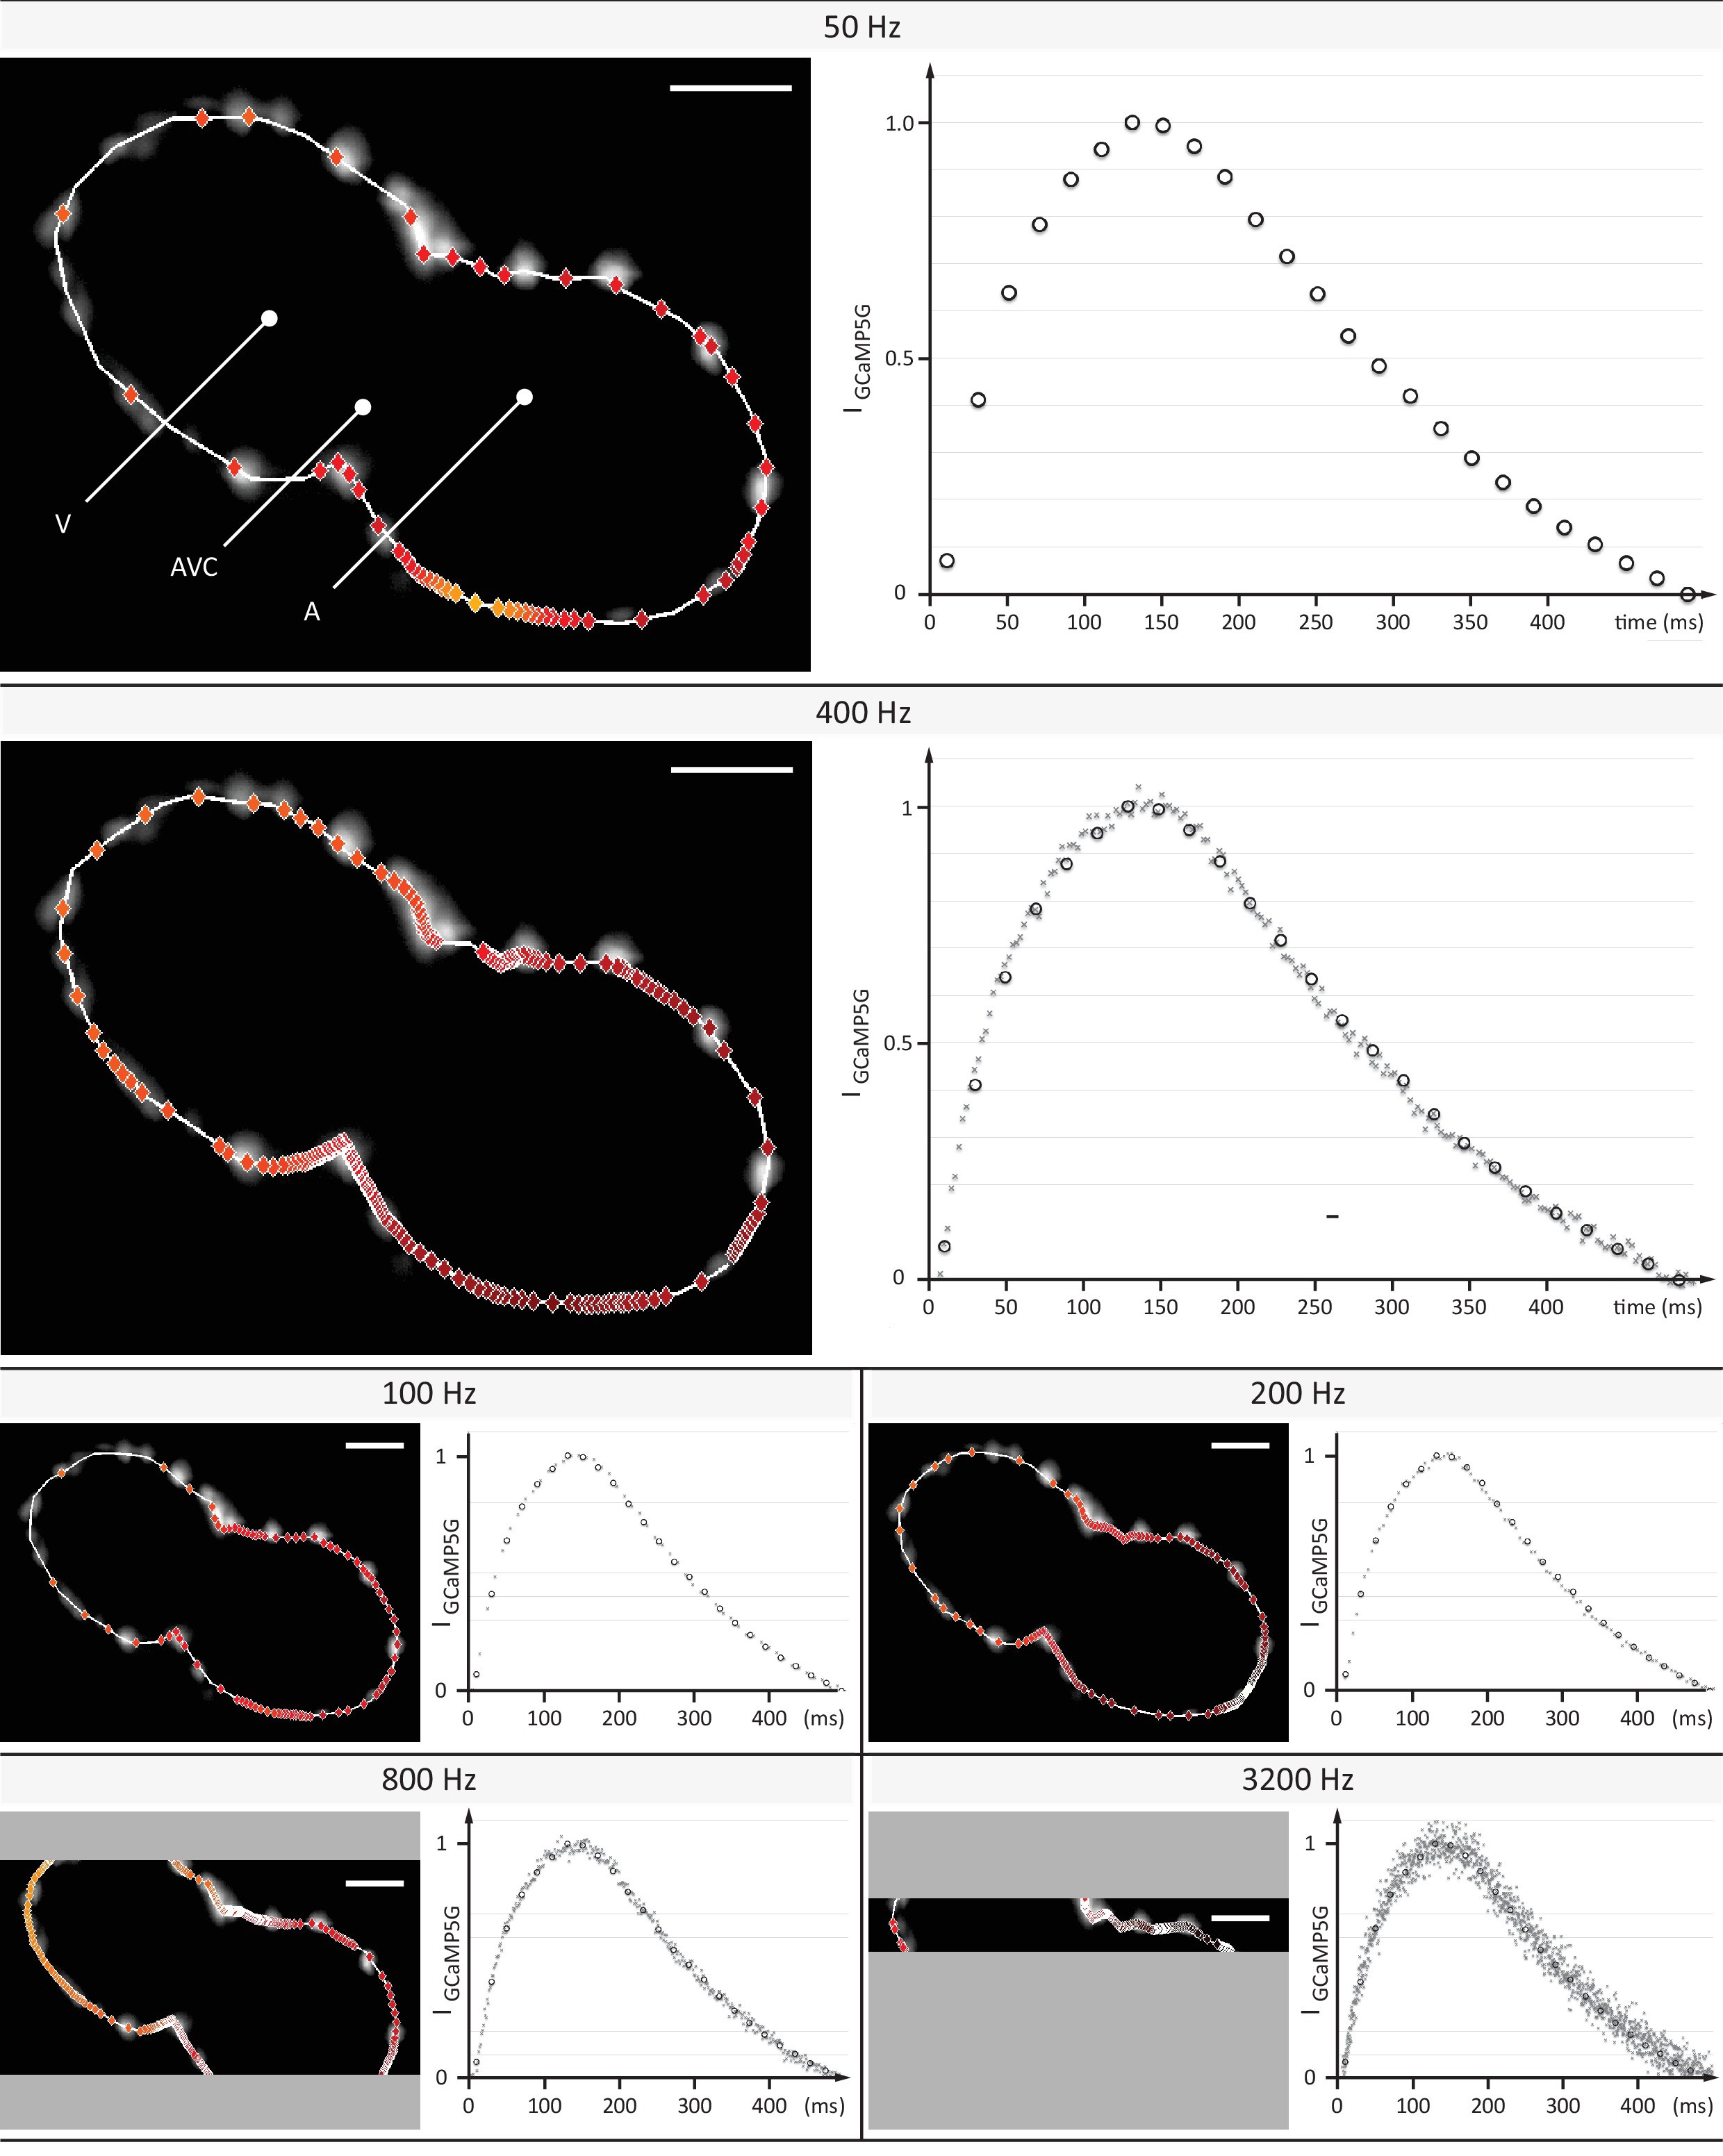
Evaluation of signal coverage and tracing precision using the fluorescent calcium reporter GCaMP5G at different recording speeds.
Optical sections across the silenced heart of a 2 days post fertilization (dpf) zebrafish embryo expressing GCaMP5G and H2A-mCherry in cardiomyocytes, recorded at 50 to 3200 Hz (exposure times 20 to 0.3 ms) with a constant pixel size of (0.5 µm)2. Raw image data of H2A-mCherry are shown to mark cell positions. Red markers indicate location of peak fluorescence intensities across a single cardiac cycle. Gray areas in 800 Hz and 3200 Hz images indicate the proportion of the field of view that could not be recorded, as the number of lines imaged is the speed-limiting factor on the sCMOS camera. Plots show normalized fluorescence intensity over time, measured in a sub region with GCaMP5G signal. Circles show data points from the measurement at 50 Hz as reference. Higher recording speed results in a better representation of the calcium transient until 400–800 Hz, especially during the initial rise in intensity. At an even higher rate of 3200 Hz, noise deteriorates the signal. Peak intensities could be traced with cellular precision at 400 and 800 Hz, before signal noise reduced precision.