
Image
|
Figure Caption
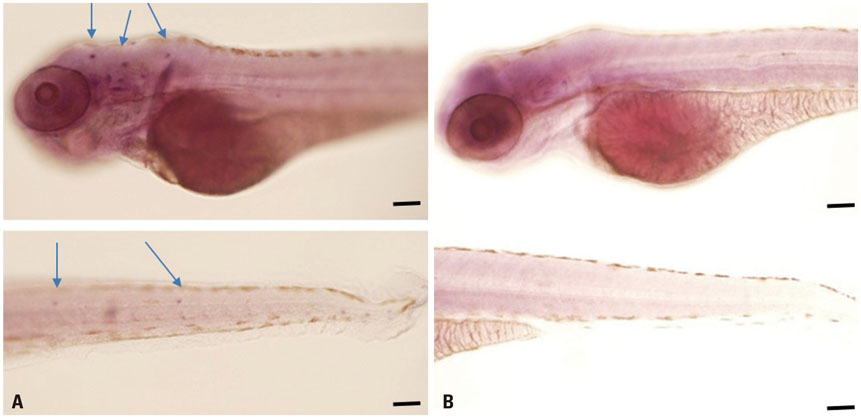
Fig. 4 In situ hybridization of miR-183 after MO injection. (A) The larvae injected with standard MO shows clear miR-183 expression in neuromast cells at 122 hours post fertilization (arrows). (B) In contrast, miR-183 expression disappeared in larvae injected with MO-183. Scale bar, 50 µm. miR, miRNA; MO, morpholino.
Figure Data
Acknowledgments
This image is the copyrighted work of the attributed author or publisher, and
ZFIN has permission only to display this image to its users.
Additional permissions should be obtained from the applicable author or publisher of the image.
Full text @ Yonsei Med. J.