
|
Fig. 5
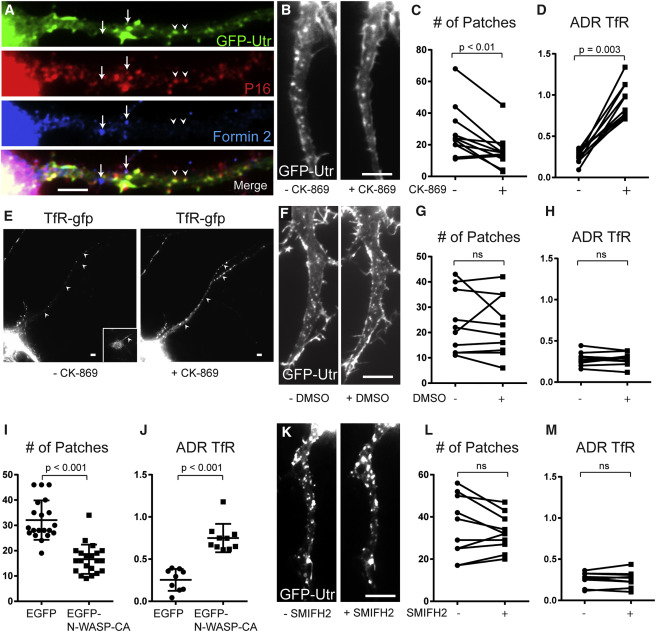
Actin Patches Are Dependent on ARP2/3 but Not on Formin 2
(A) 13-DIV cortical neuron expressing GFP-Utr and co-immunostained for P16 (red), Formin 2 (blue), and GFP (green) shows colocalization between actin patches and the ARP2/3 complex but not Formin 2. Arrows point to regions that express Formin 2, but not Utr-GFP or P16. Arrowheads point to regions that express Utr-GFP and P16, but not Formin 2.
(B) Axon expressing GFP-Utr before and after exposure to CK-869 for 30 min.
(C) Numbers of actin patches in the proximal axon before and after exposure to CK-869 for 30 min (n = 11 neurons, 4 cultures).
(D) ADR (axon-to-dendrite ratio) showing the relative amount of TfR-GFP in the proximal axon before and after exposure to CK-869 (n = 11 neurons, 4 cultures).
(E) Cortical neuron expressing TfR-GFP before and after exposure to CK-869. Inset shows ankyrin G staining. Arrowheads point to axon.
(F) Proximal axon in cortical neuron expressing GFP-Utr before and after exposure to DMSO.
(G) Number of actin patches in proximal axon before and after exposure to DMSO (n = 10 neurons, 5 cultures). ns, not significant.
(H) ADR of TfR before and after exposure to DMSO (n = 10 neurons, 5 cultures).
(I) Number of actin patches in proximal axon of neurons expressing EGFP (n = 20 neurons, 3 cultures) and neurons expressing EGFP-NWASP-CA (n = 21 neurons, 3 cultures). Neurons co-expressed TagRFP-Utr.
(J) ADR of TfR in cortical neurons co-expressing either EGFP (n = 9 neurons 2 cultures) or EGFP-N-WASP-CA (10 neurons, 3 cultures).
(K) Proximal axon in neuron expressing GFP-Utr before and after exposure to SMIFH2.
(L) Number of actin patches in proximal axon before and after exposure to SMIFH2 (n = 10 neurons, 2 cultures).
(M) ADR of TfR before and after exposure to SMIFH2 (n = 10 neurons, 2 cultures).
Scale bars, 5 μm.
See also Figure S5.