
Fig. S5
- ID
- ZDB-IMAGE-180420-49
- Publication
- Richter et al., 2017 - Small molecule screen in embryonic zebrafish using modular variations to target segmentation
- All Figures
- Figures for Richter et al., 2017
|
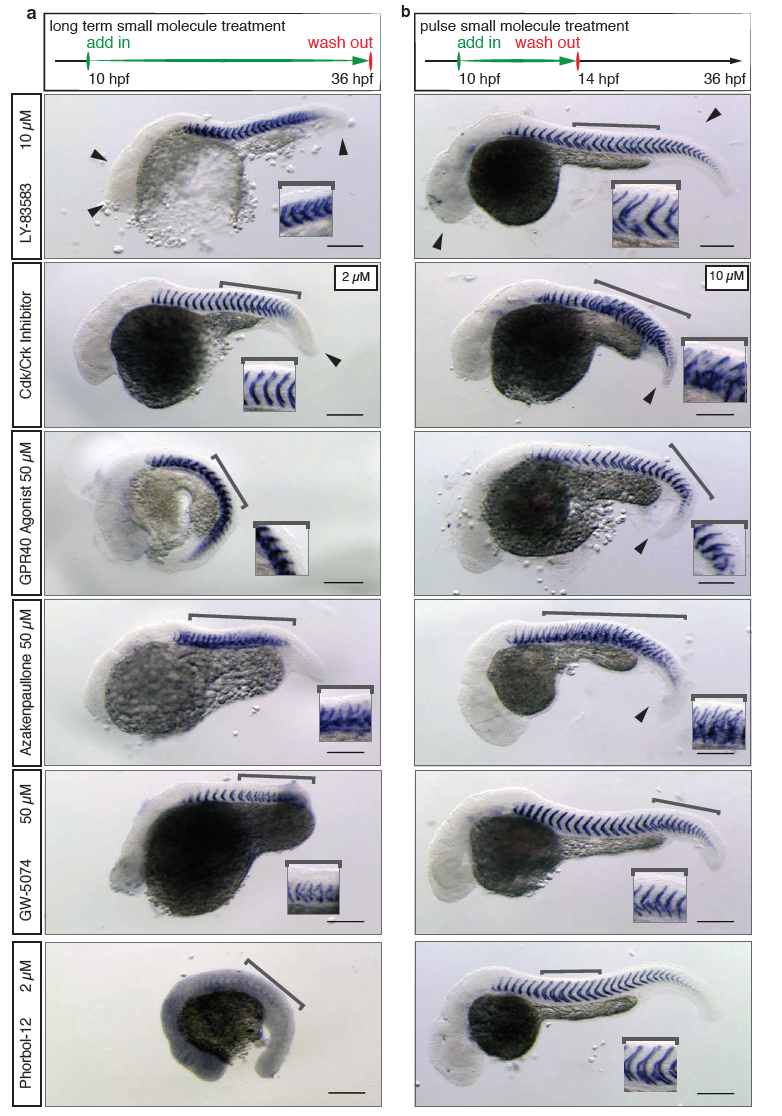
Fig. S5
Pulse treatments with higher segmentation-specificity
Hits previously hidden in the general morphology cluster that were identified after 4h pulse treatment with subsequent washout. Small molecules and concentration used are labelled in the left panel. Anterior to the right, posterior to the left of each image. (a) Embryonic phenotypes as observed after long-term treatment during screen. (b) Embryonic phenotypes showing higher segmentation-specificity after shorter pulse treatment. In the case of the Cdk/Crk inhibitor, the 10 μM long-term treatment was lethal, so the 2 μM long-term treatment is shown instead. Insets show zoom-in of the segment pattern and defects. Brackets indicate the area of the axis where segment boundary defects occurred. Scale bar is 200 μm.