
Fig. 1
- ID
- ZDB-IMAGE-180420-39
- Publication
- Richter et al., 2017 - Small molecule screen in embryonic zebrafish using modular variations to target segmentation
- All Figures
- Figures for Richter et al., 2017
|
Fig. 1
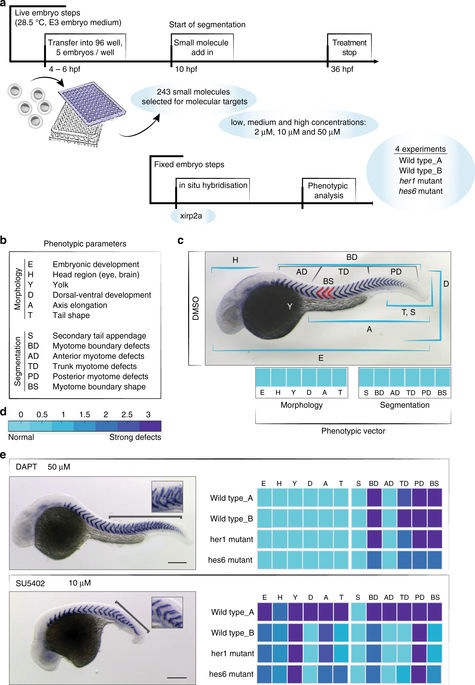
Screening strategy and phenotypic scoring. a Schematic overview of the screening set up. b Criteria for phenotypic scoring based on morphological (E, H, Y, D, A, T) and segmentation parameters (S, BD, AD, TD, PD, BS). Each are rated from 0 to 3 (normal to strong difference) compared to untreated controls. All parameters together generate a phenotypic vector for each treatment. c Wild type control embryo at 36 hpf, after xirp2a in situ hybridization, illustrating the different scoring parameters evaluated on fixed embryos at the stage of 36 h post fertilization (hpf). Segmentation parameters (S, BD, AD, TD, PD, BS) evaluated the quality of formed segments at different axial localization (AD, BD, TD) and overall segment boundary quality (BD), shape (BS) or dorsal-ventral segment defects (S) based on xirp2a mRNA expression. The phenotypic vector displayed below the image reflects a normally developed embryo. d Numerical parameter score converted into a color scale bar. e Representative phenotypes of positive controls: 50 µM DAPT shows posterior myotome boundary defects (bracket and inset) without altering embryonic development otherwise; 10 µM SU5402 affected embryonic development, with a reduction in antero-posterior axis and yolk extension, together with posterior myotome boundary defects (bracket and inset). Associated fingerprints for each positive control illustrate low phenotypic variation in different experiments. Scale bar: 200 µm