
Fig. S5
- ID
- ZDB-IMAGE-180420-38
- Publication
- Dogra et al., 2017 - Opposite effects of Activin type 2 receptor ligands on cardiomyocyte proliferation during development and repair
- All Figures
- Figures for Dogra et al., 2017
|
Fig. S5
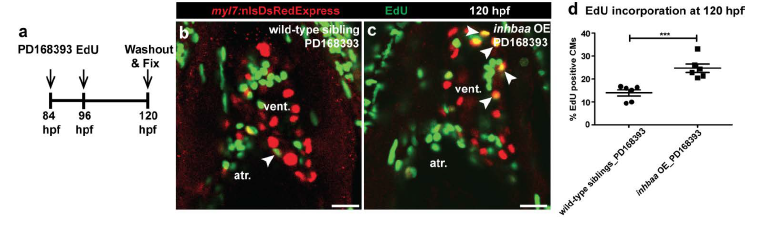
inhbaa GOF promotes CM proliferation during ErbB2 signaling inhibition. (a) Experimental setup of PD168393 treatment, EdU exposure, followed by fixation. (b, c) Tg(myl7:nlsDsRedExpress) hearts of PD168393-treated wild-type sibling and inhbaa OE larvae at 120 hpf; α-DsRed (red), EdU (green). White arrowheads point to proliferating CMs (EdU+/DsRed+). (d) Quantification of CM proliferation in PD168393-treated wild-type sibling (n=6) and inhbaa OE (n=6) ventricles at 120 hpf. All cell counts were performed on non-overlapping confocal planes (thickness, 1μm) (data are mean ± s.e.m., ***P ≤ 0.001 - Student’s t-test, two-tailed). Scale bars, 20 μm. vent., ventricle; atr., atrium.