
|
Fig. S1
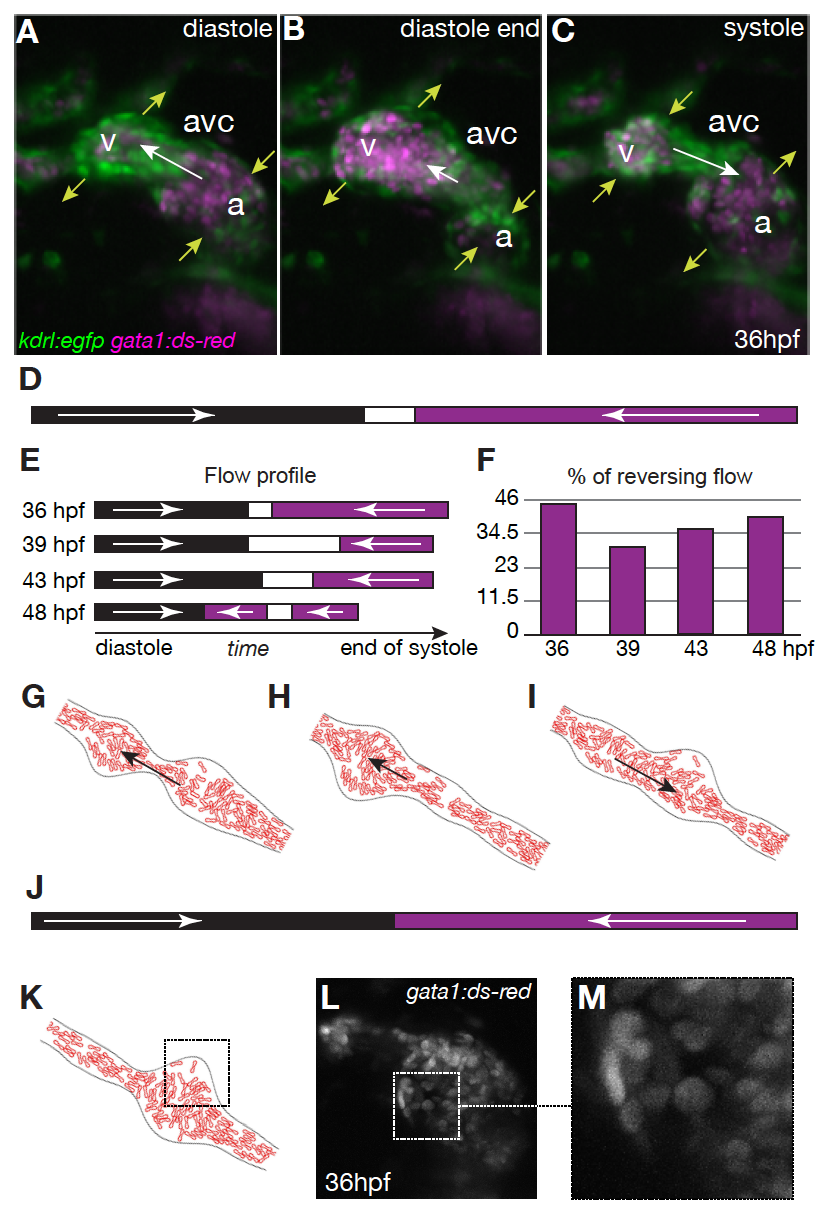
Reversing, oscillatory flow in the AVC between 36 and 48 hpf. A-C) Maximum projection of the three-dimensional reconstruction of a 36 hpf Tg(fli:kaede;gata1:dsRed) zebrafish heart at three different instants of the heart beat. The dsred labelled red blood cells are shown in magenta, while endocardial cells are shown in green. D,E) Flow direction in the AVC at D) 36hpf and E) between 36-48 hpf: magenta, flow moves from atrium to ventricle; black, flow is from ventricle to atrium; white, no flow or not visible. F) Average percentage of reversing flow per heart beat. G-I) Computational model for RBC flows between 36-48 hpf at three different instants of the heart beat (cf. Movie 1). J) Flow direction in the AVC model: solid arrows point in the direction of the flow. Dashed squares point out the uneven-time dependent distribution of RBCs in K) the model, and L,M) in vivo.