
Fig. 2
- ID
- ZDB-IMAGE-180420-28
- Genes
- Antibodies
- Publication
- Dogra et al., 2017 - Opposite effects of Activin type 2 receptor ligands on cardiomyocyte proliferation during development and repair
- All Figures
- Figures for Dogra et al., 2017
|
Fig. 2
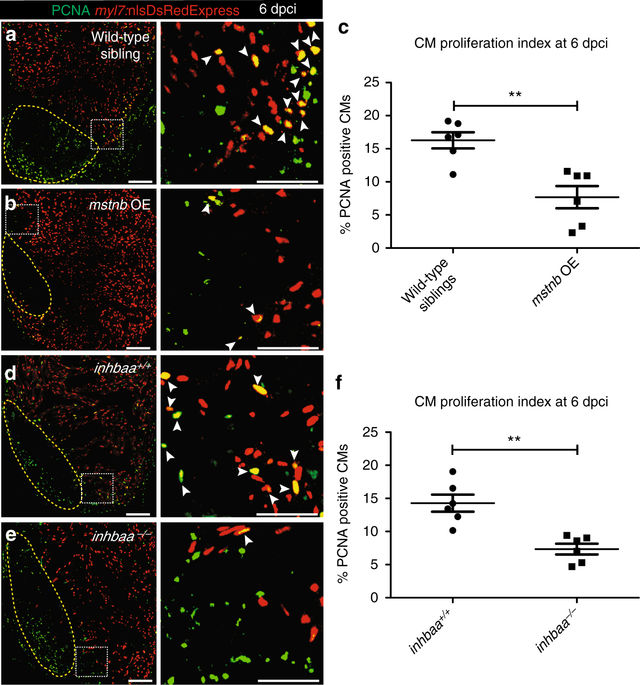
mstnb GOF and inhbaa LOF suppress CM proliferation during cardiac regeneration. a, b Sections of wild-type sibling and mstnb OE cryoinjured hearts in Tg(myl7:nlsDsRedExpress) background at 6 dpci; α-DsRed (red), PCNA (green). Yellow dotted regions delineate the injured area. Higher magnifications of dashed boxes in a, b are shown on right side. White arrowheads point to proliferating CMs (PCNA+/DsRed+). c Quantification of CM proliferation in wild-type sibling (n = 6) and mstnb OE (n = 6) cryoinjured hearts in the 100 µm region adjacent to the injured area at 6 dpci. d, e Sections of inhbaa +/+ and inhbaa −/− cryoinjured hearts in Tg(myl7:nlsDsRedExpress) background at 6 dpci; α-DsRed (red), PCNA (green). Higher magnifications of dashed boxes in d, e are shown on right side. f Quantification of CM proliferation in inhbaa +/+ (n = 6) and inhbaa −/− (n = 6) cryoinjured hearts in the 100 µm region adjacent to the injured area at 6 dpci. All cell counts were performed on three sections from each heart. Each data point on dot plot represents one heart (data are mean ± s.e.m., **P ≤ 0.01—Student’s t test, two-tailed). Scale bars: heart sections, 100 µm; higher magnifications, 50 µm