
|
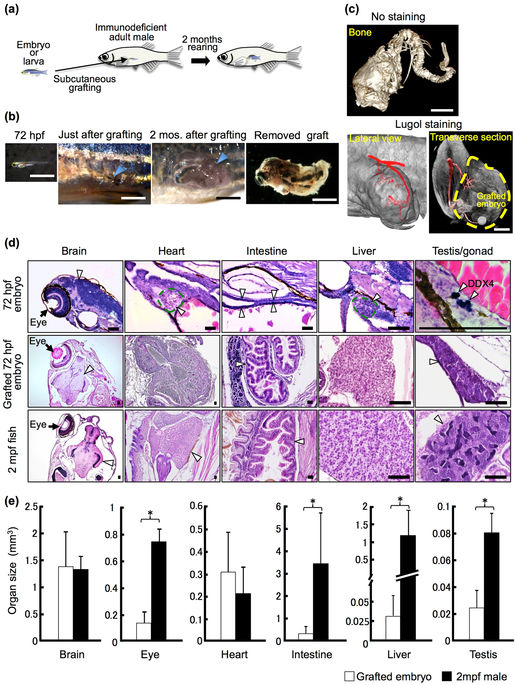
Fig. 1
Development of grafted 72 hpf embryos and organ growth in rag1 mutant hosts. (a) Schematic of whole-embryo transplantation. (b) Representative 72 hpf embryos and grafted embryos. Arrowheads indicate the site of the subcutaneous embryo graft. Scale bar: 2 mm. (c) µ-CT imaging of the grafted embryo 2 months after transplantation. Cranial bones and vertebrae were observed in the grafted embryos without staining. Using Lugol staining, a vascular structure was observed. Note that the posterior cardinal vein (red) of the recipient is connected to the grafted embryo (yellow dotted line). Scale bar: 1 mm. (d) Histology of the 72 hpf embryo, the 72 hpf embryo graft 2 months after transplantation, and the 2 mpf fish. Germ cells of 72 hpf embryos were stained with anti-DDX4 (Vasa) antibody to identify the primitive gonad. Arrowheads indicate each organ as labelled above the panels. Scale bar: 80 µm. (e) Comparison of organ size between grafted 72 hpf embryos 2 months after transplantation and normal 2 mpf males. The volume of each organ was calculated from serial sections of grafts (n = 12 brains, 11 eyes, 11 hearts, 12 intestines, 8 livers, and 6 testes) and of 2 mpf males (n = 3). Error bars indicate standard deviation. *p < 0.01 (Student’s t-test).