
|
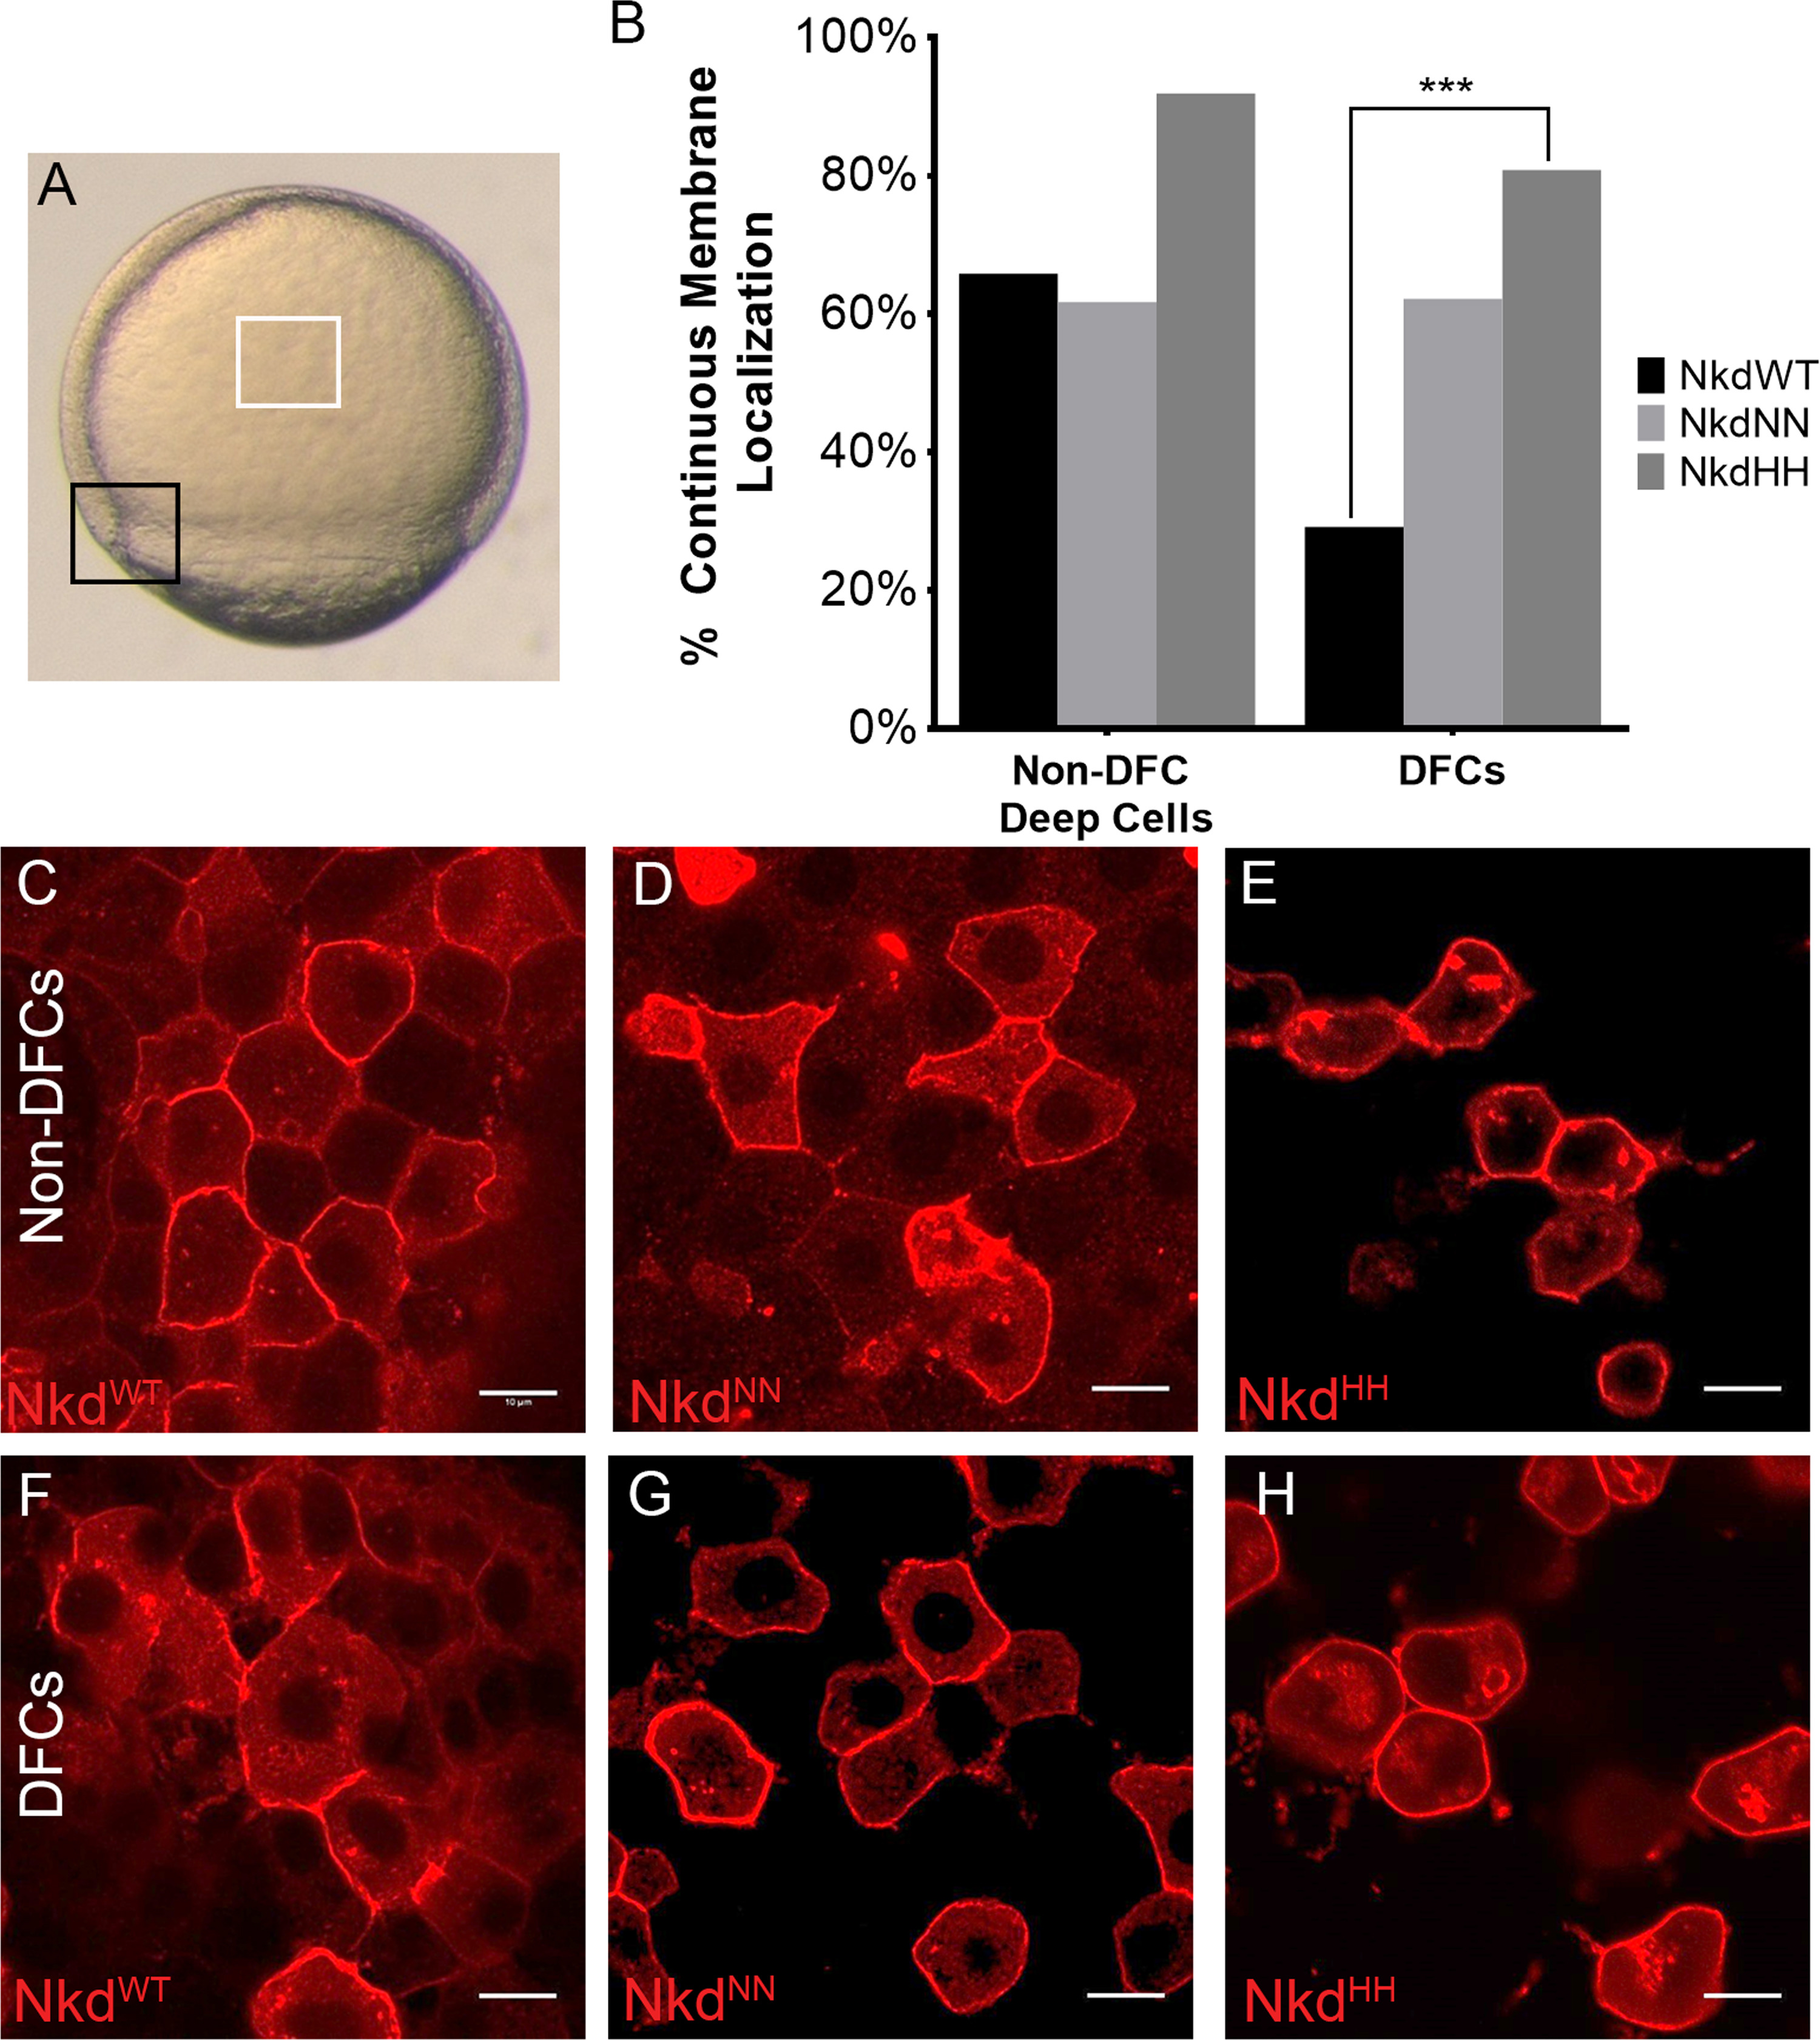
Fig. 2 Nkd localization changes in calcium fluxing and quiescent cells. (A) Calcium-fluxing dorsal forerunner cells (DFCs) (black box) and calcium-quiescent non-DFC deep cells (white box) used for localization studies. (B) Analysis of continuous versus discontinuous membrane localization of all Nkd forms in the non-DFC deep cells and the DFCs. NkdWT shows a different localization pattern than NkdNN and NkdHH, which remain mostly membrane-bound. (C and F) NkdWT, NkdNN (D and G), and NkdHH (E and H) localization in the non-DFCs (C-E) and the DFCs (F-H). (F) Quantification of membrane localization. NkdWT shows a significantly different change in localization. ****= P-value<1×10⁻⁵, Fisher's exact test, two tail. NkdWT non-DFC n=120, NkdNN non-DFC n=94, NkdHH non-DFCs n=62, NkdWT DFC n=106, NkdNN DFC n=106, NkdHH n=52, n= number of cells. Scale bar 10 µm. Taken at 63x at 2x zoom. See also Fig. S3.
Reprinted from Developmental Biology, 434(1), Marsden, A.N., Derry, S.W., Schneider, I., Scott, C.A., Westfall, T.A., Brastrom, L.K., Shea, M., Dawson, D.V., Slusarski, D.C., The Nkd EF-Hand Domain Modulates Divergent Wnt Signaling Outputs in Zebrafish, 63-73, Copyright (2017) with permission from Elsevier. Full text @ Dev. Biol.