
Image
|
Figure Caption
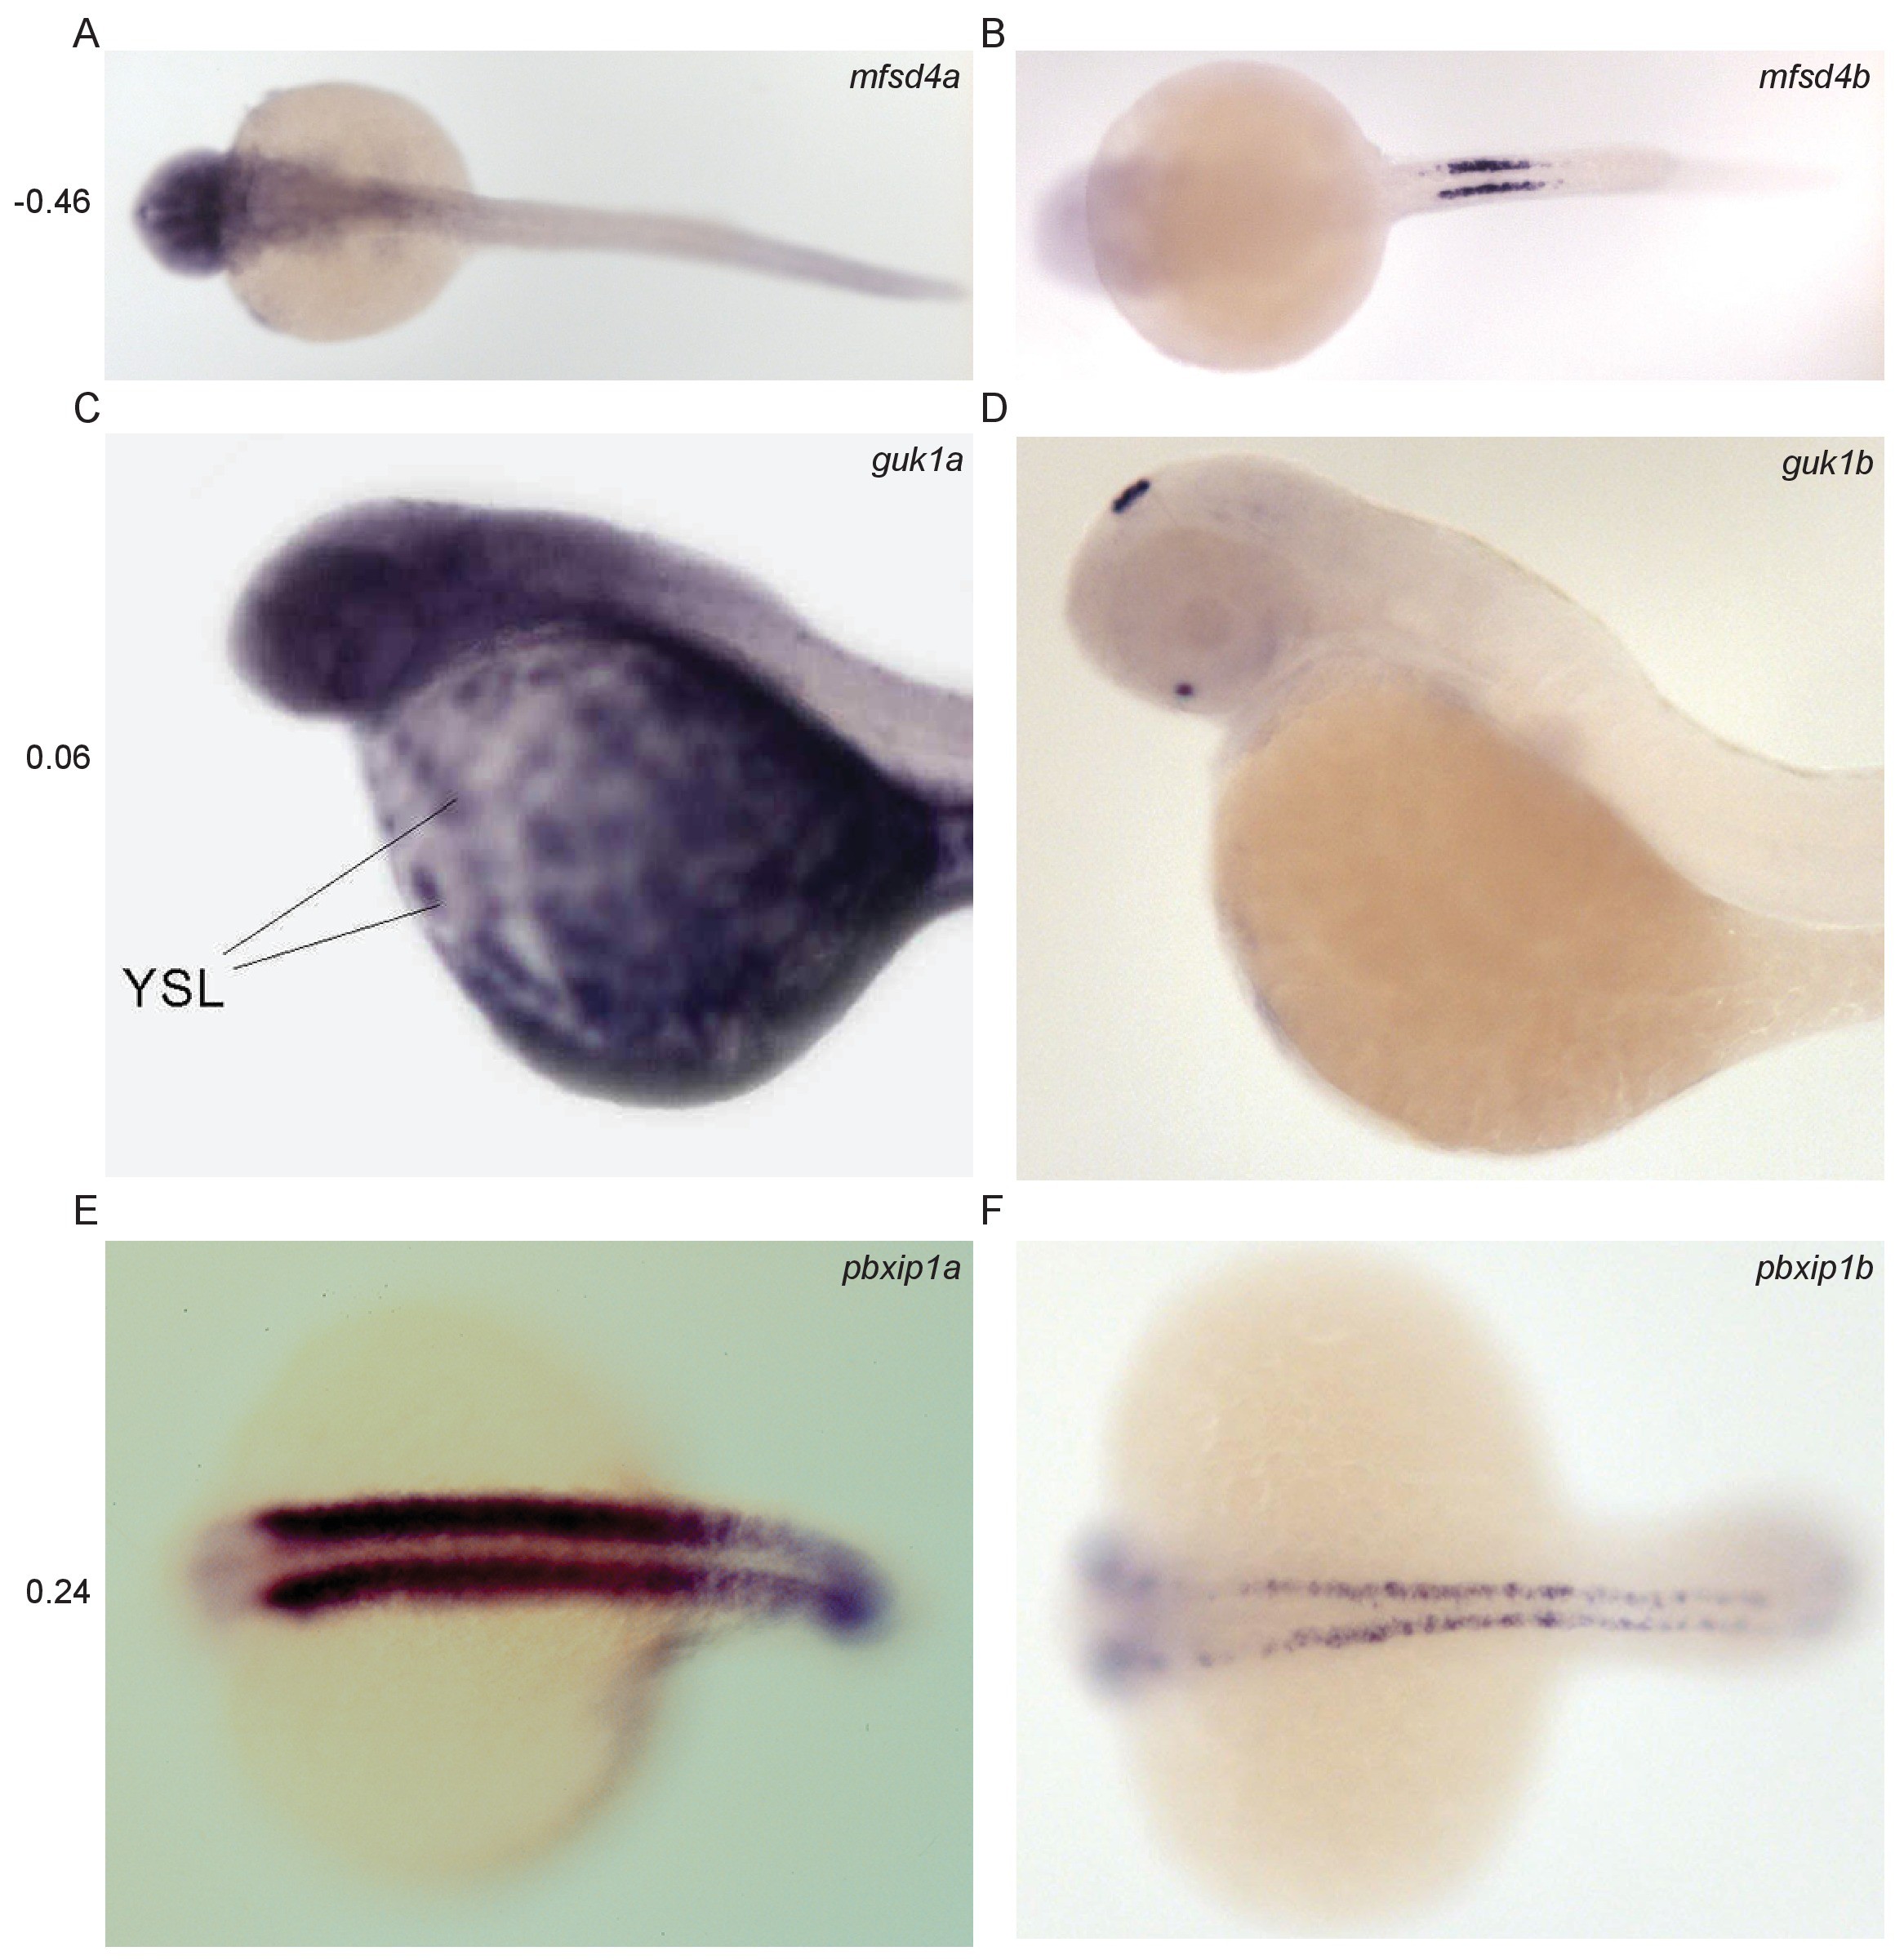
Fig. 6-S1 Divergent expression of paralogous pairs.
Images from ZFIN (ZFIN.org) of examples of paralogous gene pairs with diverged expression patterns. The Pearson correlation coefficient between the RNA-seq expression profiles of each pair is shown to the left. (A–B) mfsd4a (ENSDARG00000023768, ZDB-IMAGE-041130–790) and mfsd4b (ENSDARG00000008263, ZDB-IMAGE-060810–3118). (C–D) guk1a (ENSDARG00000030340, ZDB-IMAGE-020816–64) and guk1b (ENSDARG00000005776, ZDB-IMAGE-060216–46). (E–F) pbxip1a (ENSDARG00000071015, ZDB-IMAGE-020919–1927) and pbxip1b (ENSDARG00000011824, ZDB-IMAGE-050208–1397).
Acknowledgments
This image is the copyrighted work of the attributed author or publisher, and
ZFIN has permission only to display this image to its users.
Additional permissions should be obtained from the applicable author or publisher of the image.
Full text @ Elife