
IMAGE
Fig. 1
- ID
- ZDB-IMAGE-180410-41
- Publication
- Sun et al., 2017 - Proximal Tubular Expression Patterns of Megalin and Cubilin in Proteinuric Nephropathies
- All Figures
- Figures for Sun et al., 2017
Image
|
Figure Caption
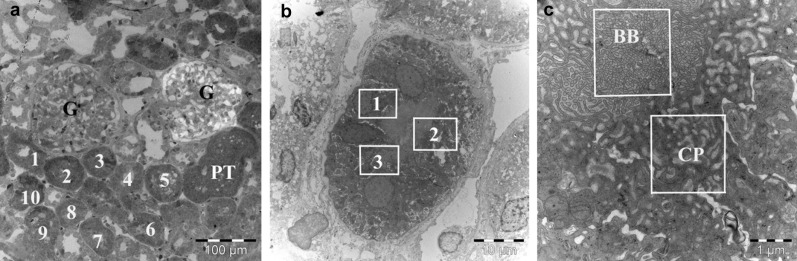
Fig. 1
Immunoelectron microscope images show the collection of images for the semiquantification in proximal tubules (PT). (a) Ten proximal tubules (1–10) were randomly selected, and (b) in each tubule, 3 different areas (1–3) were randomly selected. (c) In each area, 1 image (original magnification ×39,000), brush border (BB) and adjacent apical cytoplasm area (CP), was taken separately. G, glomerulus.
Acknowledgments
This image is the copyrighted work of the attributed author or publisher, and
ZFIN has permission only to display this image to its users.
Additional permissions should be obtained from the applicable author or publisher of the image.
Full text @ Kidney Int Rep