
Fig. S4
- ID
- ZDB-IMAGE-180410-31
- Publication
- Sawamiphak et al., 2017 - Transient cardiomyocyte fusion regulates cardiac development in zebrafish
- All Figures
- Figures for Sawamiphak et al., 2017
|
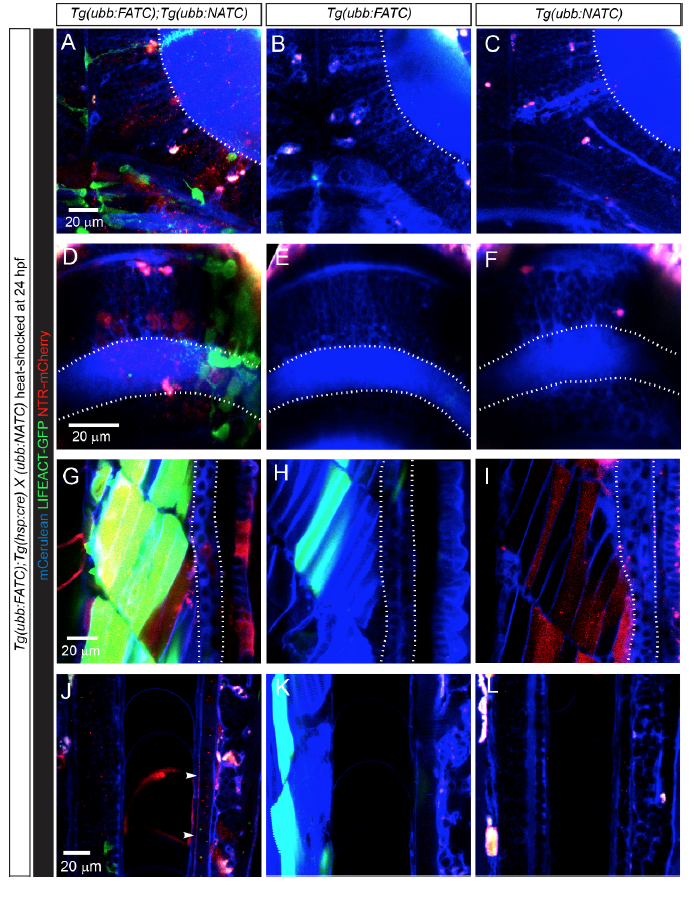
Fig. S4
Comparable expression patterns of FATC and NATC reporters in specific tissues. Embryos from crosses of Tg(hsp:cre);Tg(ubb:FATC) to Tg(hsp:cre);Tg(ubb:NATC) animals were heat-shocked at 24 hpf and sorted at 3 dpf as Tg(ubb:FATC);Tg(ubb:NATC) (A, D, G, and J), Tg(ubb:FATC) (B, E, H, and K), or Tg(ubb:NATC) (C, F, I, and L) based on LIFEACT-GFP (green) and NTR-mCherry (red) expression in skeletal muscles. Skeletal muscle (H and K), myocardium, and skin (see Fig. S1) are the only tissues showing LIFEACT-GFP or NTR-mCherry expression in the presence of Tg(ubb:FATC) or Tg(ubb:NATC) alone. Radial glial cells and neurons in the brain (A-C), and the retina (D-F), pronephric duct cells (G-I), and endothelial cells (J-L) expressed F/NATC reporter only in Tg(ubb:FATC);Tg(ubb:NATC) larvae (in which Cre recombination of both transgenes can generate GAL4 and UAS:LIFEACT-GFP, or UAS:NTR-mCherry, expression cassettes independently of ploidy number or fusion). All images are average or maximum intensity projections of 20 (A-F) and 4 (G-L) μm thick confocal stacks of 6 dpf larvae. White dashed lines mark tectal neuropil (A-C), inner plexiform layer (D-F), pronephros (G-I). White arrowheads (J) point to NATC+ cells in the dorsal aorta. Note that some autofluorescent cells are present in the brain (A-C), skin and gut (J-L). 6 Tg(hsp:cre);Tg(ubb:FATC), 9 Tg(hsp:cre);Tg(ubb:NATC), and 8 Tg(hsp:cre);Tg(ubb:FATC); (ubb:FATC) animals were examined.