
Fig. S3
- ID
- ZDB-IMAGE-180410-30
- Publication
- Sawamiphak et al., 2017 - Transient cardiomyocyte fusion regulates cardiac development in zebrafish
- All Figures
- Figures for Sawamiphak et al., 2017
|
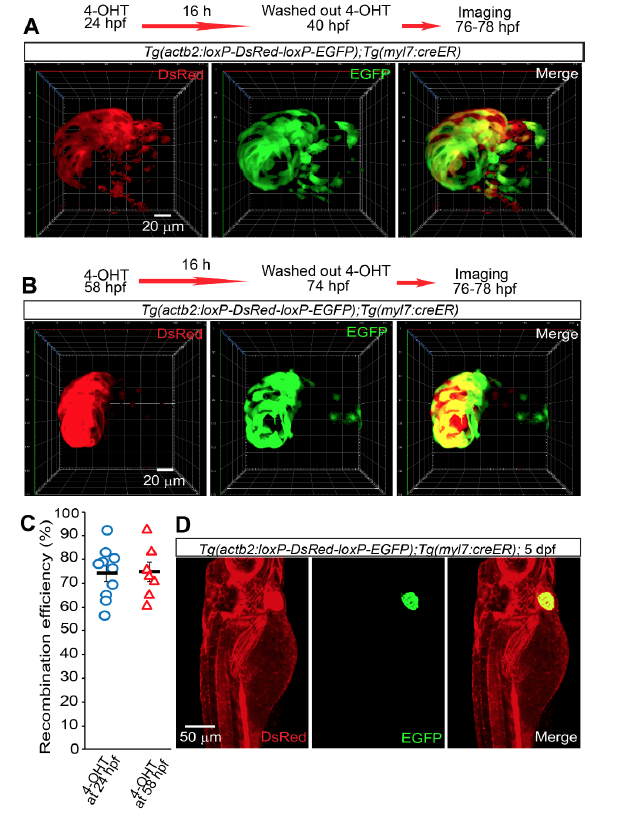
Fig. S3
Recombination efficiency and tissue specificity of Tg(myl7:CreER). Tg(actb2:loxP-DsRed-loxP-EGFP);Tg(myl7:creER) embryos were treated with 4-OHT from 24 to 48 (A) or from 58 to 74 (B) hpf. Cre recombination-mediated EGFP (green) expression and non-recombined cells expressing DsRed (red) were assessed by live imaging from 76 to 78 hpf. Since it was not possible to count the number of cells due to the dense expression pattern of DsRed and EGFP, in order to quantify recombination efficiency we measured the area covered by EGFP expression (recombined cells) and the total cardiac ventricle area (combined EGFP and DsRed signals) in each Z-plane. C, Graph showing recombination efficiency calculated as percentage of GFP+ area/total cardiac ventricle area. D, myl7:creER mediates myocardial specific recombination. 4-OHT treatment of Tg(actb2:loxP-DsRed2-loxP-EGFP);Tg(myl7:creER) embryos from 24 to 40 hpf resulted in EGFP (green) expression only in the myocardium, imaged at 5 dpf, despite ubiquitous expression of DsRed (red). 3D volume renderings (A and B) or maximum intensity projections (D) of 170 (A), 122 (B), 406 (D) μm thick confocal stacks are shown. A and B are ventral views, anterior up. D is lateral view, anterior up and dorsal to the left. Bars and error bars in C represent means±S.E.M. Each circle (n=10) and triangle (n=7) represents a heart. 10 (A), 7 (B), and 5 (C) animals were analyzed.