
Fig. 1
- ID
- ZDB-IMAGE-180410-21
- Publication
- Sawamiphak et al., 2017 - Transient cardiomyocyte fusion regulates cardiac development in zebrafish
- All Figures
- Figures for Sawamiphak et al., 2017
|
Fig. 1
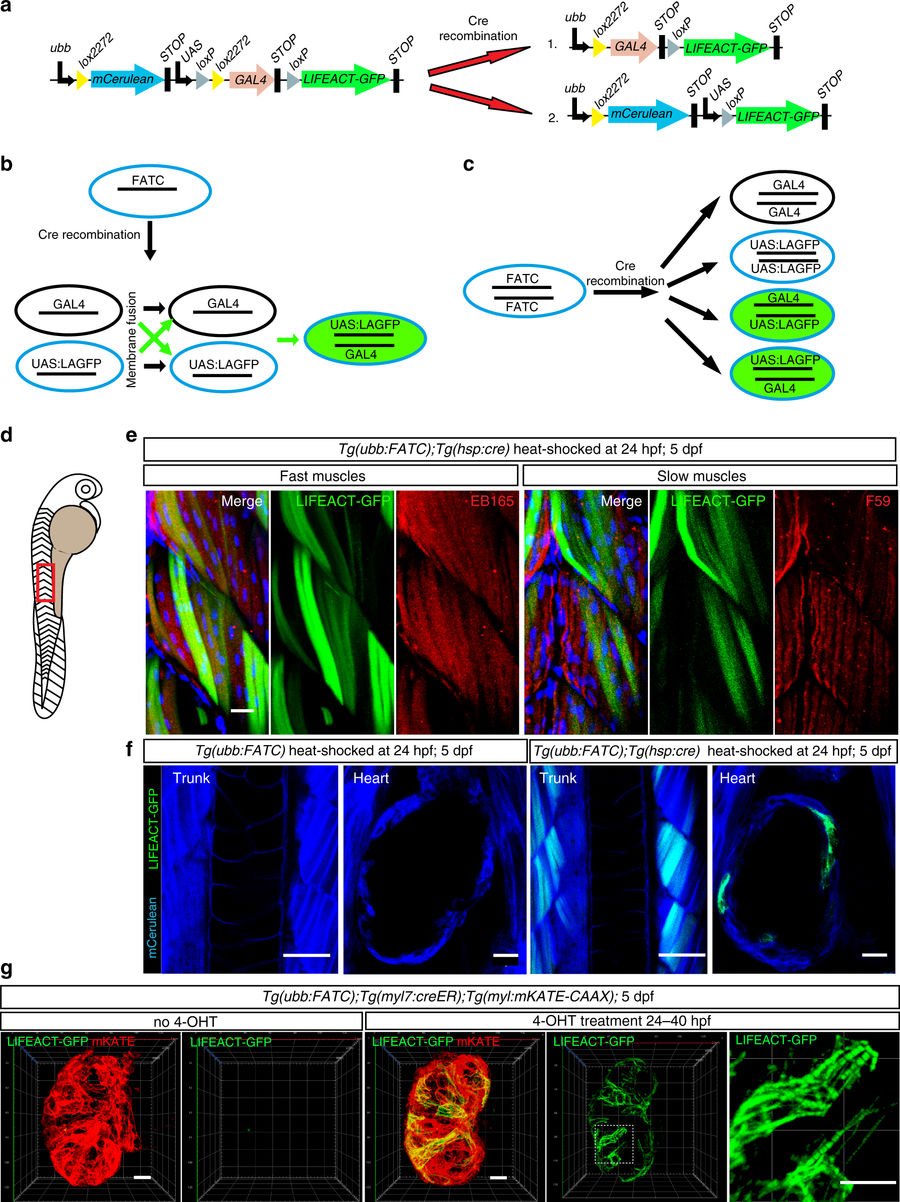
Establishment of the FATC transgenic line for in vivo labeling of fusion-derived cells. a Schematic illustration of the ubb:FATC construct and Cre recombination products. b, c Schematic illustrations of membrane fusion (b) and multiple transgene insertions (c) that could give rise to LIFEACT-GFP expression. b Cre recombination of Tg(ubb:FATC) animals harboring a single copy of the transgene generates two different cell populations, one carrying a GAL4 expression cassette and the other carrying a UAS:LIFEACT-GFP (LAGFP) cassette. Fusion between cells carrying different cassettes (green arrows), but not between cells carrying the same cassette (black arrows), leads to activation of LIFEACT-GFP expression (green). c Stochastic Cre recombination in cells harboring two copies of the FATC transgene will generate 50% of the time cells carrying both the GAL4 and UAS:LIFEACT-GFP cassettes (green). d, e LIFEACT-GFP expression is activated in fast twitch, but excluded from slow twitch, muscles. d Drawing of a zebrafish larva depicting the trunk area (red box), shown in e. e Tg(ubb:FATC);Tg(hsp:cre) embryos were heat-shocked at 24 hpf, and LIFEACT-GFP expression (green) was assessed at 5 dpf. Muscle fibers were visualized by immunostaining with EB165 and F59 (red) to label fast and slow twitch muscles, respectively. DAPI (blue) labeling shows fusion-derived multinucleation of fast twitch muscles. f heat induction of cre expression at 24 hpf activates LIFEACT-GFP (green) expression in skeletal and cardiac myocytes in 5 dpf Tg(ubb:FATC);Tg(hsp:cre) larvae, but not in Tg(ubb:FATC) animals (blue). g LIFEACT-GFP expression (green) labels sarcomeric structures of FATC-activated cardiomyocytes (identifiable by membrane expression of mKATE-CAAX (red)). Absence of LIFEACT-GFP expression without 4-OHT treatment confirms the dependency of the FATC reporter on Cre activity. e, f show maximum intensity projections of 10–50 μm thick confocal stacks. g 3D volume renderings of 90 μm thick confocal stacks of the entire cardiac ventricle. Representative images from a total of 8–9 (e), 32 (f), and 9 (g) animals are shown. Scale bars: 20 μm (e, f trunk, g), 50 μm (f heart)