
Fig. 6
- ID
- ZDB-IMAGE-180406-5
- Publication
- Suarez-Bregua et al., 2017 - Promoter architecture and transcriptional regulation of musculoskeletal embryonic nuclear protein 1b (mustn1b) gene in zebrafish
- All Figures
- Figures for Suarez-Bregua et al., 2017
|
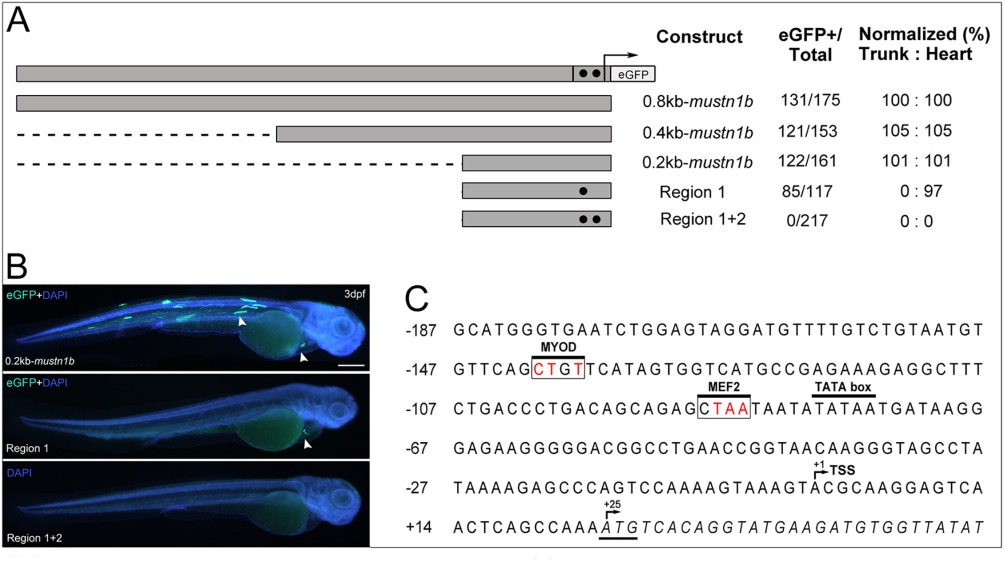
Fig. 6
Functional analysis of the mustn1b promoter through eGFP expression. A: DNA fragments containing 0.8 (P3), 0.4 (P4), and 0.2 kb (P5) sequences upstream from the ATG of mustn1b are in gray. Black circles mark conserved regions selected for mutations. Region 1, positions ‐138 ‐141 (transcription factor binding site [TFBS]: MYOD) and Region 2, positions ‐86 ‐89 (TFBS: MEF2). Arrow and hatched section denote the start of transcription and 5'UTR, with eGFP coding sequences substituting at the native ATG start site. Promoter activity was assessed as the proportion of embryos displaying one or more fluorescent mustn1b cells and normalized to the 0.8kb‐mustn1b promoter results. B: Transient expression analysis of 3‐dpf Zebrafish embryos injected with 211bp_mustn1b‐Tol2‐eGFP, Region 1, and Region1 + 2 site‐directed mutagenesis constructs. The white arrowheads indicate the eGFP expression in skeletal muscles and heart. Counterstaining with DAPI was used to visualize nuclei (blue). C: Nucleotide sequence of the Zebrafish mustn1b gene showing the distribution in the promoter region of targeted transcription‐factor binding boxes for site‐directed mutagenesis. Nucleotides are shown in uppercase letters and numbered on the left of the sequence. The transcription start site (TSS) in the 5'‐UTR is denoted by (+1). and the coding region, in italics, shows the ATG start site denoted by (+25). Transcription‐factor binding regions of interest in white box and mutated nucleotides in red. The TATA box is marked by black overhead line. Scale bars = 250 μm.