
|
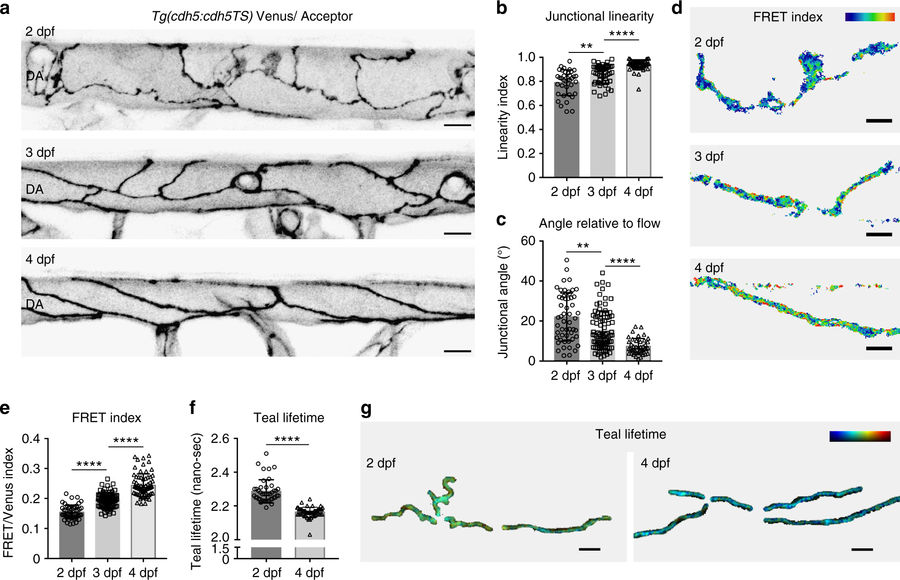
Fig. 3
Cellular morphology and VE-cadherin tensile changes occur during artery maturation. a Junctional morphology of ECs in the dorsal aorta (DA) (Venus, grey) at 2 dpf (top), 3 dpf (middle) and 4 dpf (bottom). Scale bar = 10 μm. b Junctional linearity index over time at 2 dpf (n = 37 junctions from n = 4 embryos), 3 dpf (n = 37 junctions from n = 5 embryos) and 4 dpf (n = 51 junctions from n = 4). Error bars represent mean ± s.d.; 2–3 dpf **p = 0.0010; 3–4 dpf ****p < 0.0001, from unpaired two-sided Mann–Whitney test. c Junctional angle relative to the direction of blood flow over time at 2 dpf (n = 53 junctions from n = 4 embryos), 3 dpf (n = 89 junctions from n = 5 embryos) and 4 dpf (n = 42 junctions from n = 4). Error bars represent mean ± s.d.; 2–3 dpf **p = 0.0010; 3dpf– 4dpf ****p < 0.0001 from unpaired two-sided Mann–Whitney test. d Heatmap image of ratio-metric FRET values in junctions at 2 dpf (top), 3 dpf (middle) and 4 dpf (bottom). Colors range from blue ( = low FRET index/high tension) to red ( = high FRET index/low tension). Scale bar = 5 μm. e Quantification of ratio-metric FRET values in junctions at 2 dpf (n = 54 junctional ROIs from n = 4 embryos), 3 dpf (n = 79 junctional ROIs from n = 5 embryos) and 4 dpf (n = 71 junctional ROIs from n = 4 embryos). Error bars represent mean ± s.d.; 2–3 dpf ****p < 0.0001, from unpaired two-sided t test; 3–4 dpf ****p < 0.0001 from unpaired two-sided Mann–Whitney test. f Quantification of Teal lifetime values (nano-sec) comparing n = 43 junctional ROIs segmented from 2 dpf embryos (n = 8) and n = 54 junctional ROIs from 4 dpf embryos (n = 10). Error bars represent mean ± s.d.; ****p < 0.0001 from unpaired two-sided Mann–Whitney test. g Heatmap image of Teal lifetime values in junctions of 2 dpf (left) versus 4 dpf (right) embryos. Colors range from blue ( = low lifetime/low tension) to red ( = high lifetime/high tension). Scale bar = 5 μm