
|
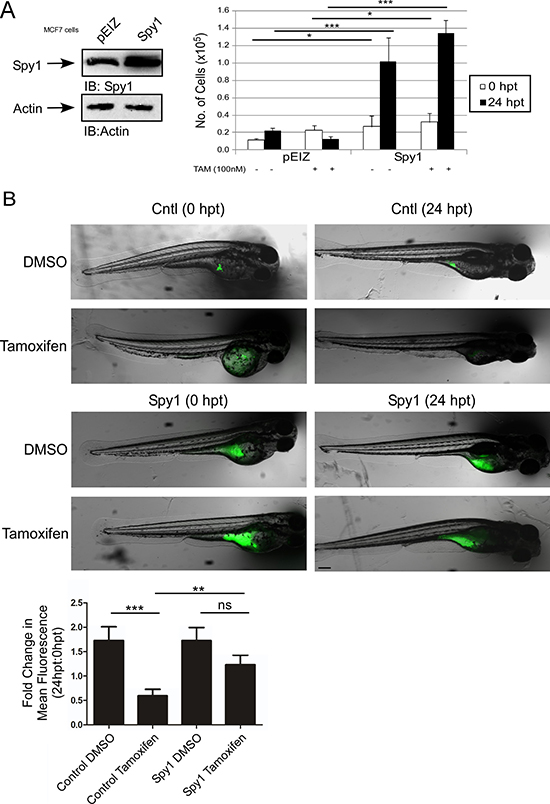
Fig. 5 Spy1 levels affect tamoxifen response in vivo. (A) MCF7 cells were infected with indicated constructs (along top of representative blot and X-axis of graph). Trypan blue exclusion assay was performed over indicated time course in the presence or absence of tamoxifen. Error bars reflect SE between triplicate experiments. (B) Representative images of injected zebrafish larvae expressing either empty control vector (top panel) or Spy1 overexpression vector (bottom panel) before (0 hpt) and after (24 hpt) treatment with either DMSO or 10 μM tamoxifen. *The same fish is depicted at 0 and 24 hpt for each condition. Scale bar = 200 μm. Graph representing the mean fold change in foci, as quantified by fluorescence as compared to 0 hpt. n = 28–46 fish/treatment (excluding mortalities). Student′s t-test was performed; ns = not significant, **p < 0.01, ***p < 0.001. Scale bar = 200 μm.