
Fig. 4
- ID
- ZDB-IMAGE-180322-7
- Antibodies
- Publication
- Mojib et al., 2017 - Zebrafish aversive taste co-receptor is expressed in both chemo- and mechanosensory cells and plays a role in lateral line development
- All Figures
- Figures for Mojib et al., 2017
|
Fig. 4
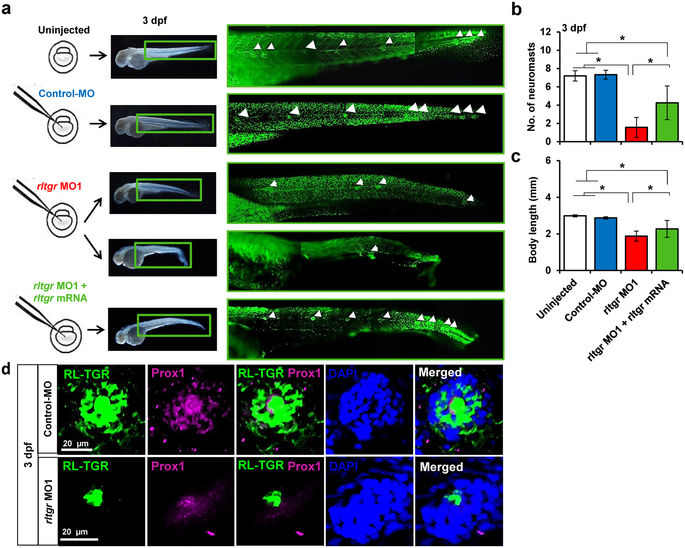
RL-TGR is involved in lateral line development. (a) Scheme showing injections of control MO, rltgr MO1 and rltgr mRNA in 1-2 cell stage embryos. At 3 dpf, the neuromasts were assessed (white arrowheads) in the respective injected populations by observing the embryos stained with SYTOX green nucleic acid stain. There was a decrease in the number of neuromasts in the rltgr morphants and the number was restored upon co-injection with rltgr mRNA (b). The bar graph shows that rescue in context with the number of neuromasts was significant (*P value < 0.0001; n = 15–16). (c) The body length of the injected populations is shown as a bar graph. Note a significant restoration of body length of rltgr morphants when co injected with rltgr mRNA (*P value < 0.0001; n = 35–66). (d) Confocal images of a single neuromast from 3 dpf control embryos and rltgr morphants (dorsal view) stained with RL-TGR (green) and neuromast marker Prox1 (magenta). DAPI stains nuclei (blue). n > 20; scale bars are shown in the images.