
IMAGE
Fig. 8
- ID
- ZDB-IMAGE-180321-9
- Publication
- Hozumi et al., 2017 - Nuclear movement regulated by non-Smad Nodal signaling via JNK is associated with Smad signaling during zebrafish endoderm specification
- All Figures
- Figures for Hozumi et al., 2017
Image
|
Figure Caption
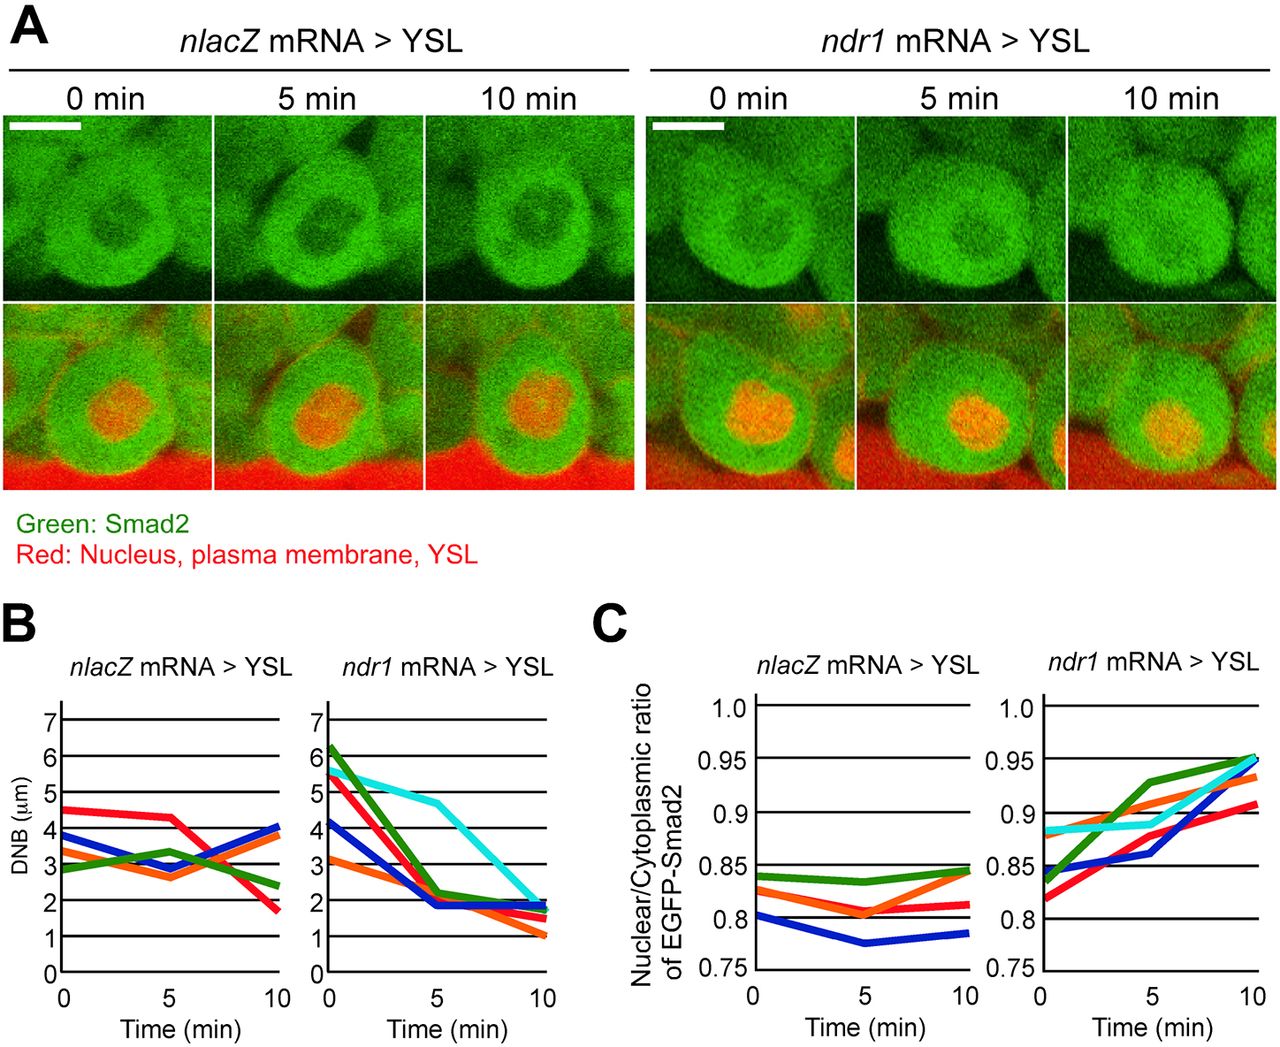
Fig. 8 Visualization of Smad2 during nuclear movement. (A) Time-lapse confocal live imaging of EGFP-Smad2 in MMCs of nlacZ mRNA>YSL or ndr1 mRNA>YSL embryos. Scale bars: 10 µm. (B,C) DNB values (B) and nuclear/cytoplasmic ratio of EGFP-Smad2 fluorescence (C) of four or five independent nuclei (colored lines) in MMCs of nlacZ mRNA>YSL or ndr1 mRNA>YSL embryos.
Acknowledgments
This image is the copyrighted work of the attributed author or publisher, and
ZFIN has permission only to display this image to its users.
Additional permissions should be obtained from the applicable author or publisher of the image.
Full text @ Development