
|
Fig. 1
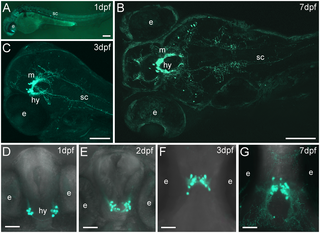
Whole mount confocal imaging showing eGFP-expressing cells and axonal projections at 1, 3 and 7 dpf (A, B and C). Confocal z-stack projection showing two clusters of Pth4:eGFP-expressing cells on the lateral hypothalamus in a ventral view (D, E and F) or dorsal view (G). The total number of eGFP cells was measured by analyzing each 2μm thick z-plane slice from the full confocal z-stack projection in each stage of development: (D) 14±2 eGFP cells at 1dpf, (E) 22±2 eGFP cells at 2dpf, (F) 29±2 and (G) 33±1 eGFP cells at 3 and 7dpf, respectively). Note that the number of cells increases over time and axonal projections become more abundant and branched (B, G). Two groups of Pth4:eGFP-expressing cells move gradually from a caudo-ventral to a more rostro-dorsal position. Abbreviation: e, eye; hy, hypothalamus; m, midbrain; sc, spinal cord. Scale bars: 100 μm (A-C) 50 μm (D-G).