
Image
|
Figure Caption
Fig. s3
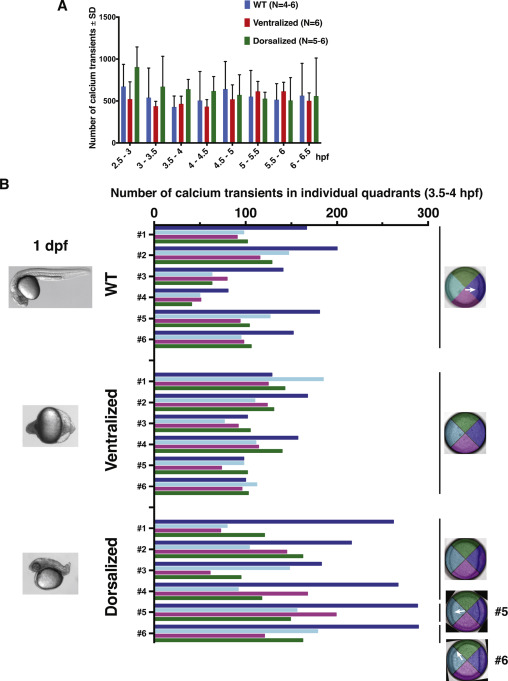
Fig. S3. Comparison of calcium transient numbers in WT and mutants. (A) Quantification of total number of EVL calcium transients in WT, ventralized, and dorsalized embryos from 2.5 hpf to 6.5 hpf. N indicates the number of embryos in each group.(B) Quantification of EVL calcium transient numbers in each quadrant at 3.5–4 hpf from individual embryos. Arrows indicate the endogenousdorsal organizer.
Acknowledgments
This image is the copyrighted work of the attributed author or publisher, and
ZFIN has permission only to display this image to its users.
Additional permissions should be obtained from the applicable author or publisher of the image.
Reprinted from Developmental Biology, 430(2), Chen, J., Xia, L., Bruchas, M.R., Solnica-Krezel, L., Imaging early embryonic calcium activity with GCaMP6s transgenic zebrafish, 385-396, Copyright (2017) with permission from Elsevier. Full text @ Dev. Biol.