
|
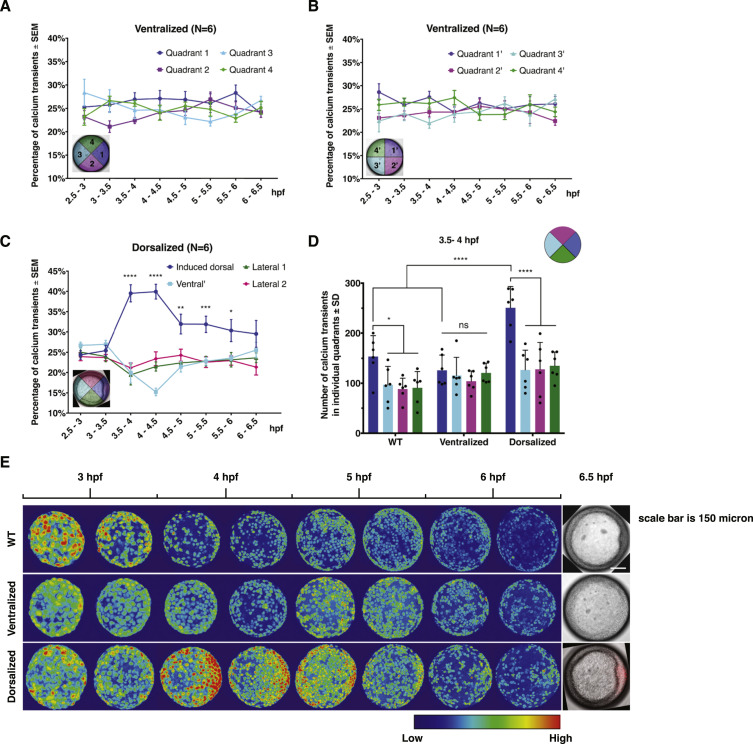
Fig. 4
EVL Ca2+ signaling pattern in ventralized and dorsalized embryos. (A-B) Automated quantification of EVL Ca2+ transient frequency in ichabod/β-catenin2 ventralized embryos between 2.5 hpf and 6.5 hpf. Error bars represent S.E.M.; N=6 embryos. (C) Automated quantification of EVL Ca2+ transient frequency in β-catenin1-injected dorsalized embryos. Induced dorsal organizer is oriented to the right. Error bars represent S.E.M. *, P≤0.05. **, P≤0.01***, P≤0.001. ****, P≤0.0001; N=6 embryos. (D) Comparison of Ca2+ transient number in individual quadrants among WT, ventralized, and dorsalized embryos at 3.5–4 hpf. Error bars represent standard deviation. ns, not significant. *, P≤0.05. ****, P≤0.0001; (E) Representative 30-min time-lapse overlay of GCaMP6s signals in WT, ventralized, and dorsalized embryos from 2.5 hpf to 6.5 hpf.
Reprinted from Developmental Biology, 430(2), Chen, J., Xia, L., Bruchas, M.R., Solnica-Krezel, L., Imaging early embryonic calcium activity with GCaMP6s transgenic zebrafish, 385-396, Copyright (2017) with permission from Elsevier. Full text @ Dev. Biol.