
|
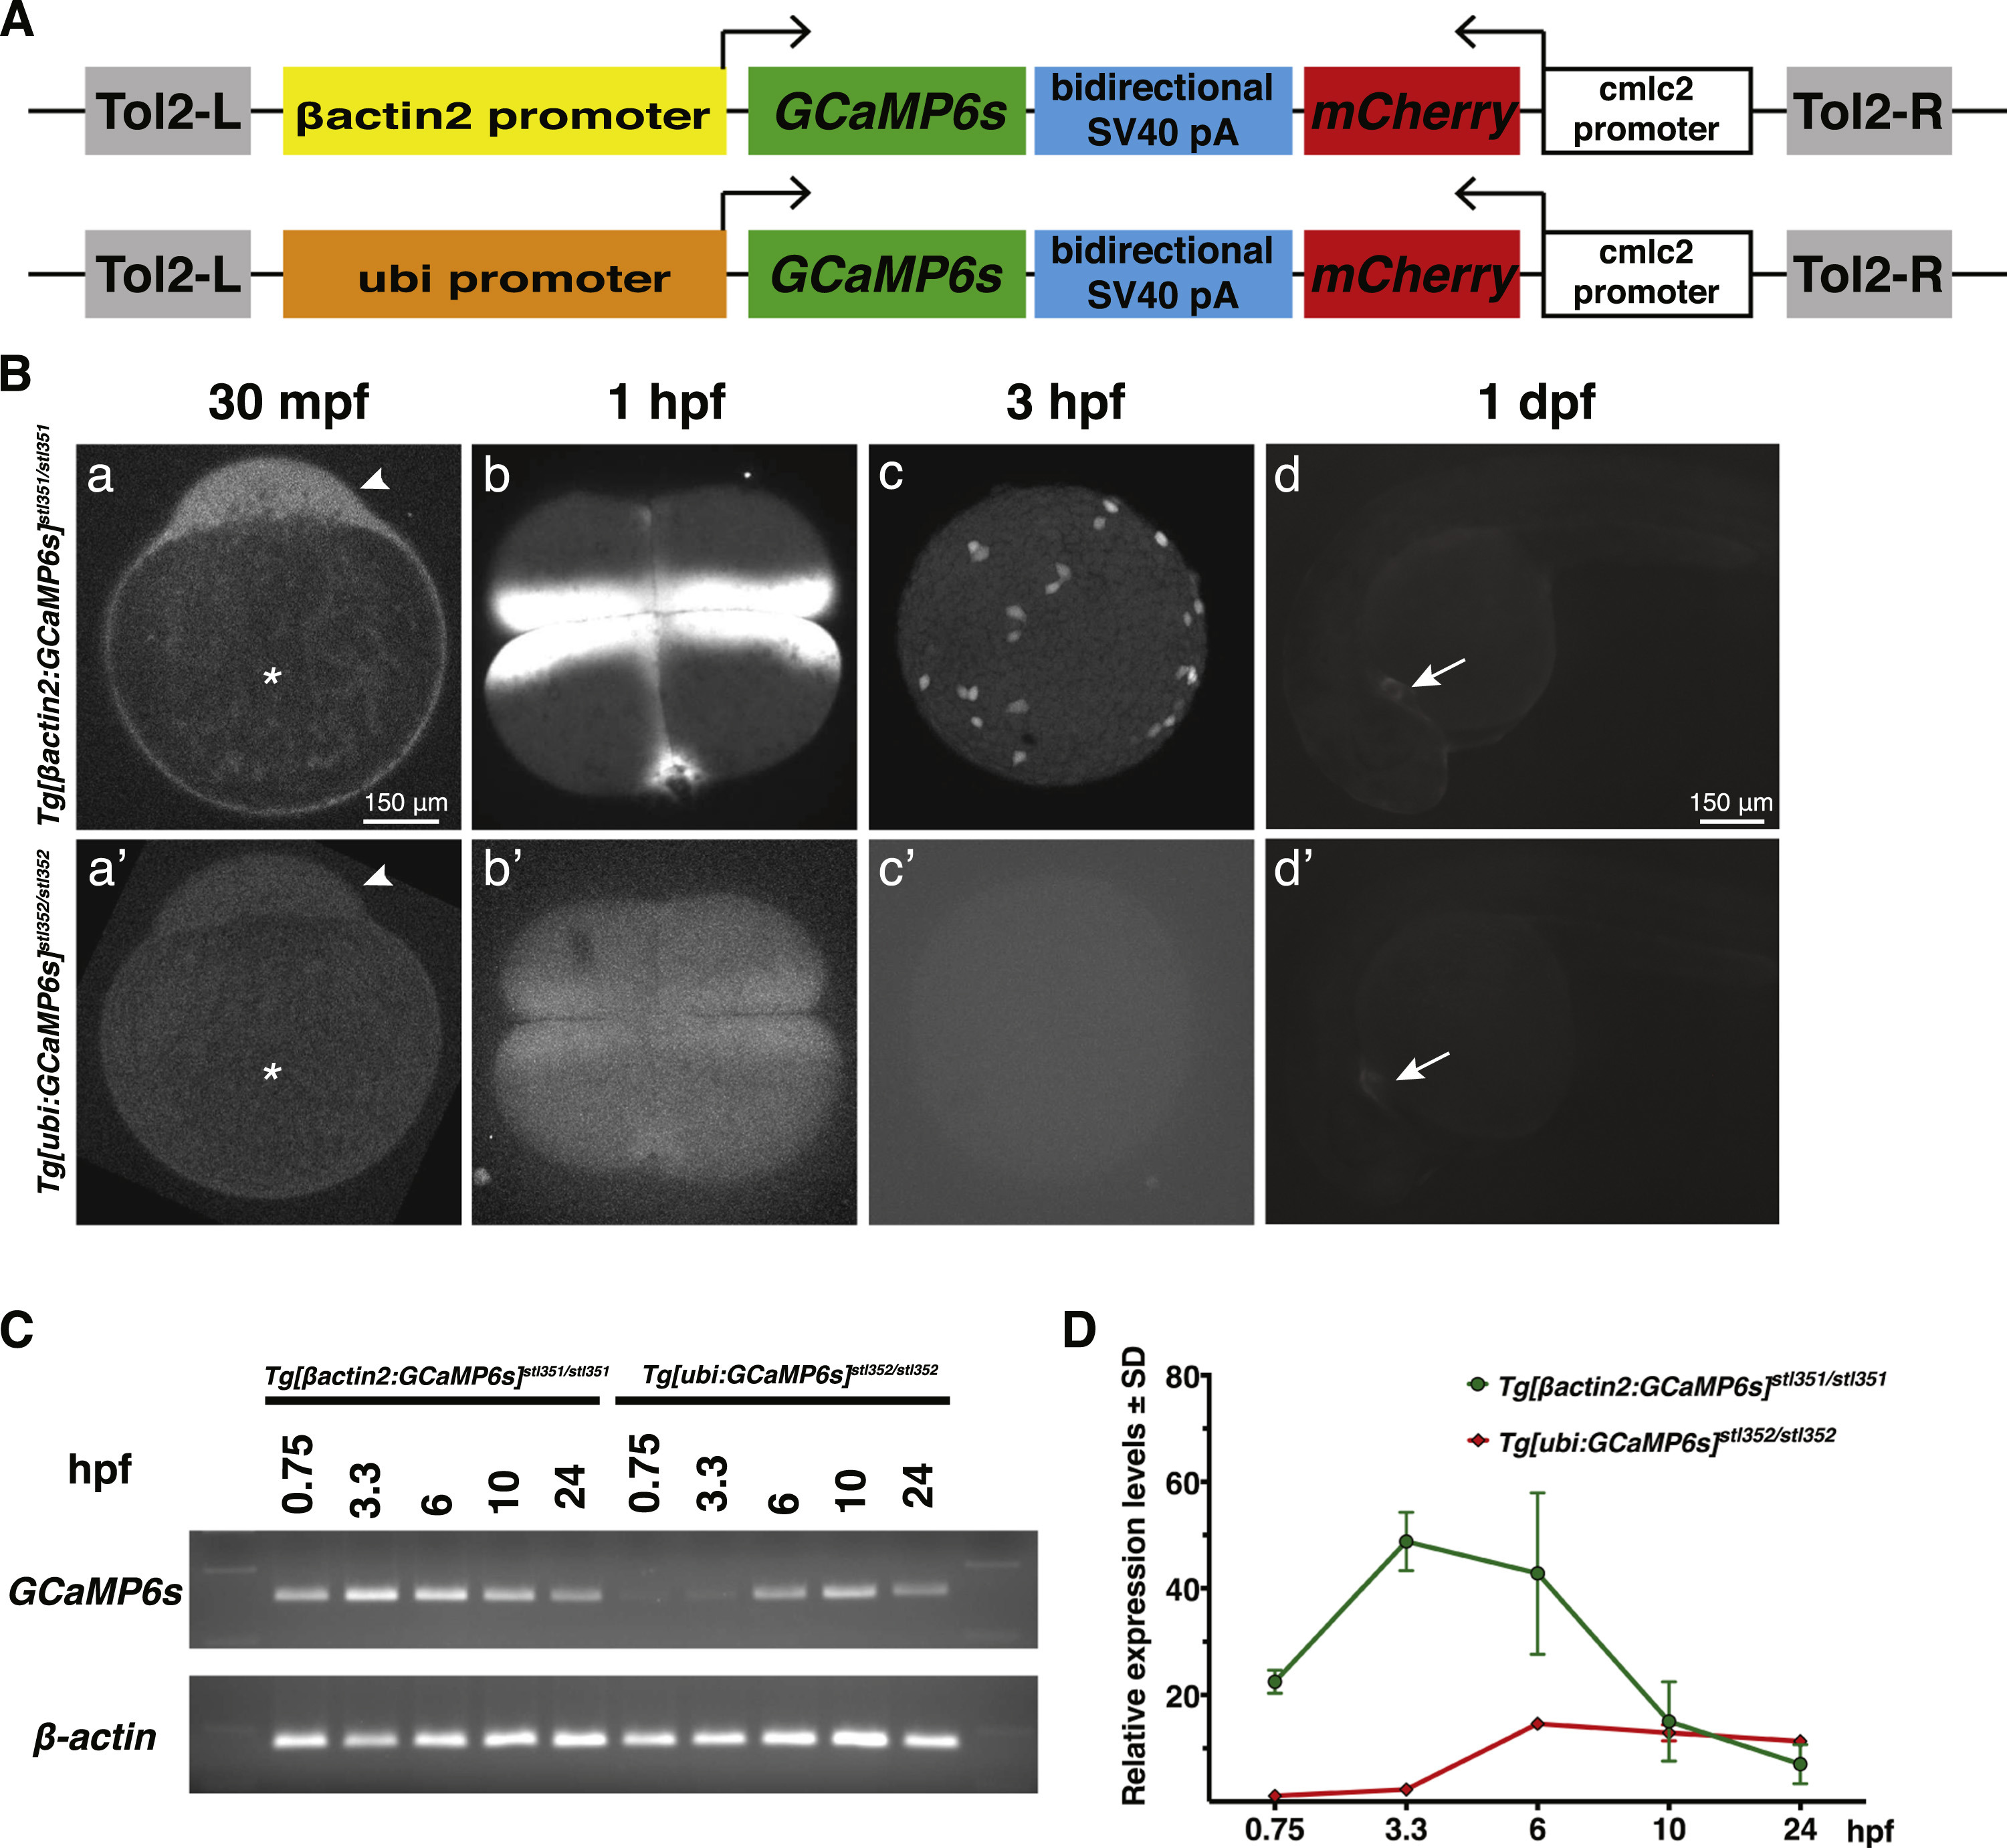
Fig. 1
GCaMP6s expression and fluorescencein Tg[βactin2:GCaMP6s]stl351/stl351 and Tg[ubi:GCaMP6s]stl352/stl352 transgenic zebrafish during early embryogenesis. (A) Schematics of the Tol2[βactin2:GCaMP6s] or Tol2[ubi:GCaMP6s] constructs. (B) GCaMP6s fluorescent confocal microscope images in Tg[βactin2:GCaMP6s]stl351/stl351 and Tg[ubi:GCaMP6s]stl352/stl352 embryos at several developmental stages. a, a’, d, d’, lateral view; b, b’, c, c’, animal pole view. Asterisks indicate the yolk, and arrowheads point to the blastodisc in a, a’. Arrows point to the heart in d, d’. (C-D)RT-PCR and qRT-PCR analyses of GCaMP6s RNA expression levels in Tg[βactin2:GCaMP6s]stl351/stl351 and Tg[ubi:GCaMP6s]stl352/stl352 embryos in the course of embryogenesis. The qRT-PCR results were normalized to β-actin. Error bars represent standard deviation; N=3.
Reprinted from Developmental Biology, 430(2), Chen, J., Xia, L., Bruchas, M.R., Solnica-Krezel, L., Imaging early embryonic calcium activity with GCaMP6s transgenic zebrafish, 385-396, Copyright (2017) with permission from Elsevier. Full text @ Dev. Biol.