Fig. 2
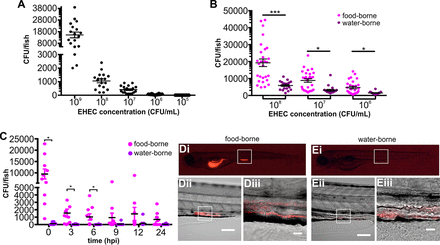
Colonization of larval zebrafish by waterborne and foodborne EHEC. (A) Waterborne EHEC infection. Zebrafish larvae were exposed to EHEC for 16 h at the indicated concentrations. Following exposure, fish were washed thoroughly and homogenized and CFU counts were determined by dilution plating on EHEC selective agar. Individual data points (n = 18 for each concentration) and means and SD are shown. (B) Zebrafish larvae were exposed to foodborne (magenta) or waterborne (purple) EHEC for 2 h, at the indicated doses. The bacterial burden was determined by dilution plating on EHEC selective agar. Individual data points (n = 28 for each condition), means, and SD are shown. (C) Zebrafish larvae were exposed to 108 CFU/ml of foodborne (magenta) or waterborne (purple) EHEC for 2 h and transferred to fresh sterile medium, and bacterial burden was determined by dilution plating on EHEC selective agar at the indicated time points. Individual data points, means (n = 10 for each condition), and SD are shown. Statistical significance was calculated using the Mann-Whitney U test (***, P < 0.005; **; P < 0.01; *, P < 0.05). (D and E) Live images of zebrafish larvae exposed to foodborne (D) or waterborne (E) EHEC::mCherry (108 CFU/ml) for 2 h. A whole embryo (i) and a magnified section of a mid-intestinal region are shown at magnifications of ×20 (ii) and ×64 (iii). Scale bars in panels D and E are 100 μm and 20 μm for panels ii and iii, respectively.

