
|
Fig. 4
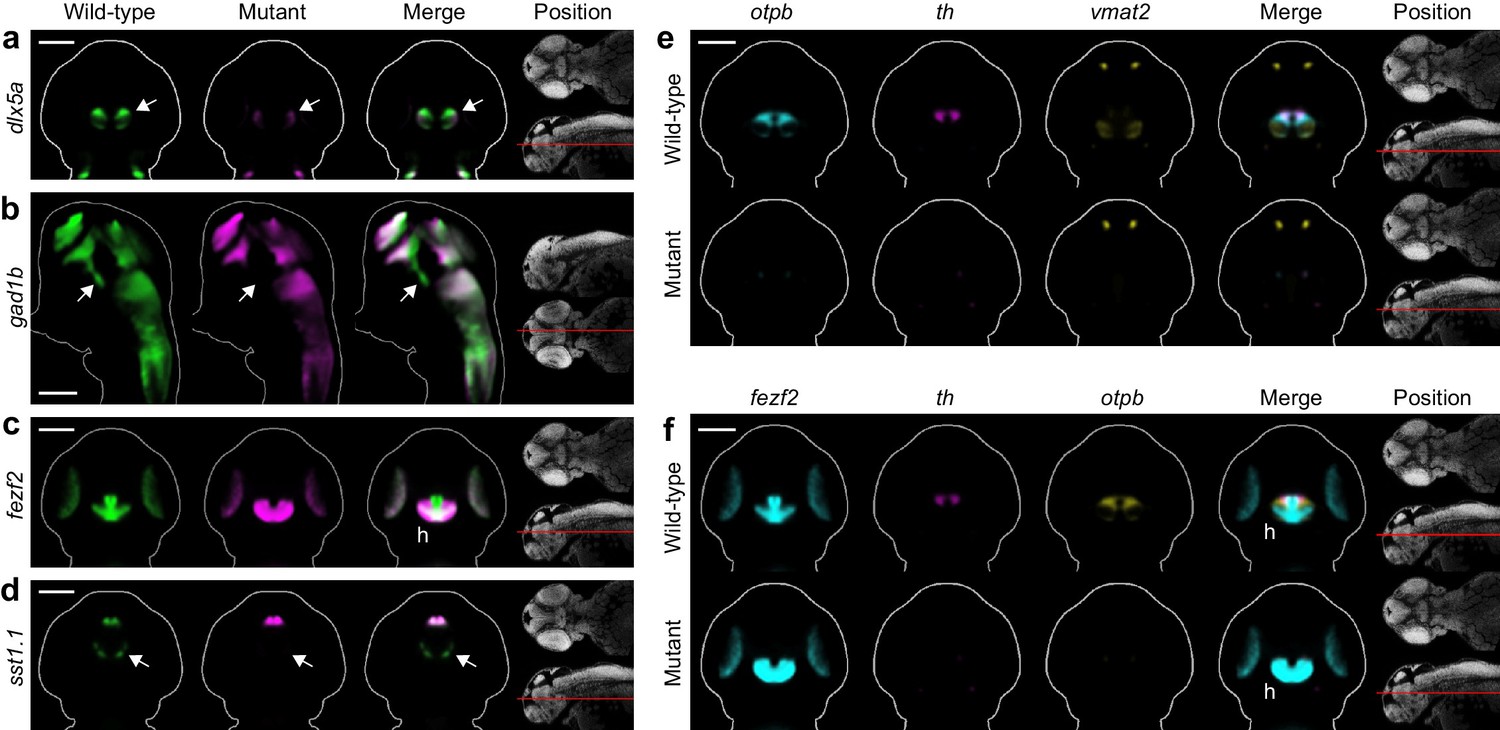
Automated phenotyping uncovers known and novel diencephalic deficits in fezf2 mutants.
(A–D) Overlay analysis of in situ expression" "patterns in wild-type and fezf2 mutant embryos at 2 dpf. Wild-type expression patterns are shown in green and fezf2 mutants are shown in magenta. Expression of the GABAergic markers dlx5a (A) and gad1b (B) is substantially reduced (arrow) in the ventral diencephalon. (C) The fezf2 expression domain is dramatically altered in the posterior hypothalamus (h). (D) A bilateral cluster of sst1.1-expressing cells (arrow) is lost in the ventral diencephalon. Other clusters are unaffected. (E–F) Multi-probe co-expression analysis of ventral diencephalic deficits in fezf2 mutants. (E) Virtual co- registration showing loss of otpb, th, and vmat2 expression domains in the ventral diencephalon. (F) Virtual co-registration showing spatial relationships between affected fezf2, th, and otpb expression domains in the posterior hypothalamus. (A–F) All 3D reconstructions are generated by averaging eight or more embryos per experimental group. The position and orientation of each 2D slice within the embryo is indicated on the Nissl-stained two photon reference image to the right of the panel. For sagittal and frontal sections anterior is to the top; for transverse sections dorsal is to the top. Scale bar: "100 μm."