
|
Fig. 6
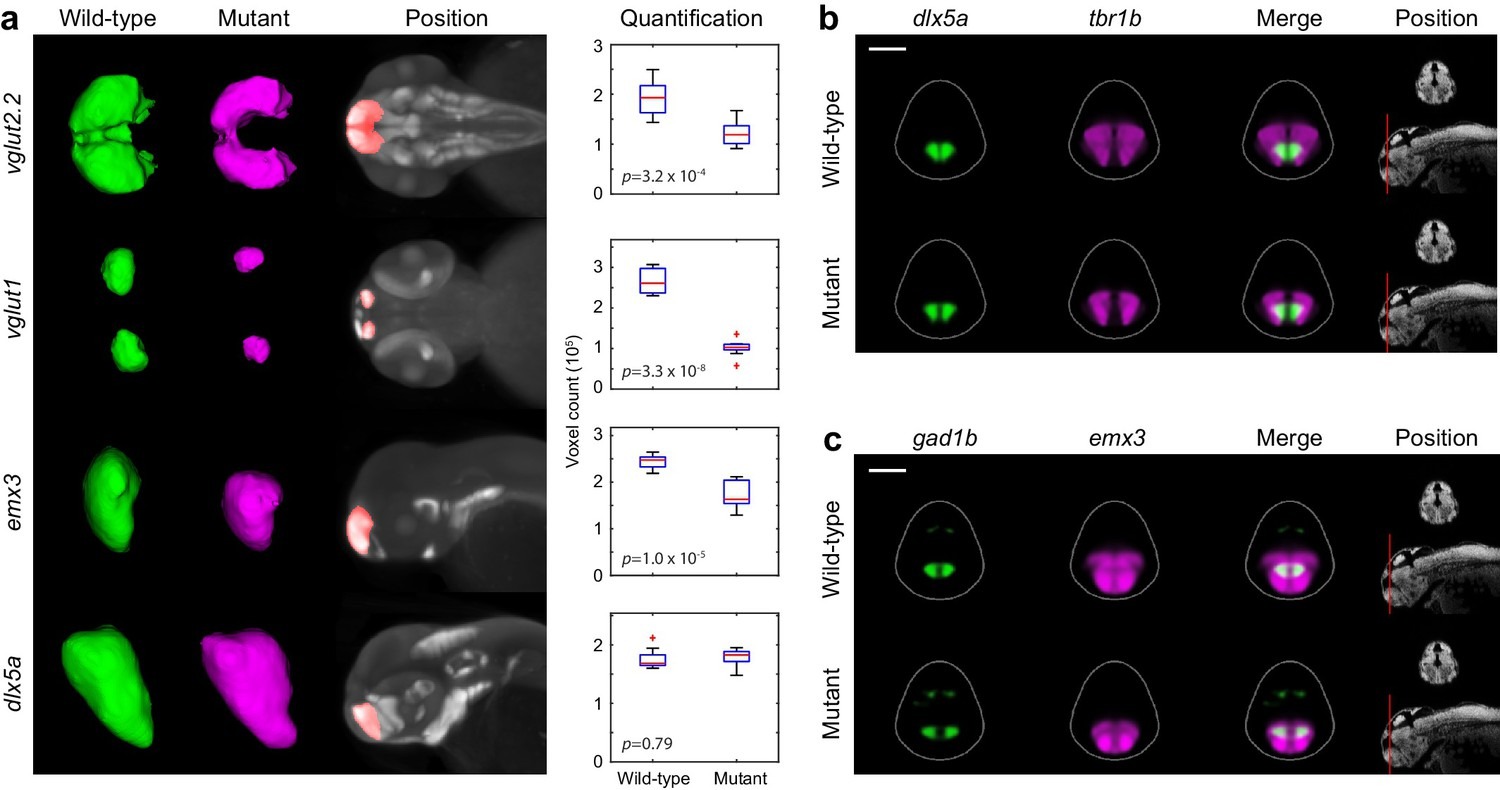
Segmentation and volume measurements.
(A) 3D segmentations and volumetric quantification of gene expression domains in the telencephalon of wild-type (green) and fezf2 mutant (magenta) embryos at 2 dpf. 3D segmentations are done independently on eight or more embryos per experimental group; averaged wild-type and mutant segmentations are shown. Position of 3D segmentations is indicated on maximum intensity projections. Box-and-whisker plots show volume measurements from 3D segmentations of the indicated probes within the telencephalon. Tops and bottoms of each box represent the 25th and 75th percentiles of the samples, respectively. Whiskers are drawn from the ends of the interquartile ranges to the furthest observations that fall within ±1.5 times the interquartile range away from the top or bottom of the box. The line in the middle of each box is the sample median. Observations beyond the whisker length are marked as outliers (+ sign). Statistical significance was determined by two-tailed t-test. Volume measurements used for box-and-whisker plots are available in Figure 6—source data 1. (B–C) Multi-probe co-expression analysis of telencephalic deficits in fezf2 mutants. The position and orientation of each 2D slice within the embryo is indicated on the Nissl-stained two photon reference image to the right of the panel. Dorsal is to the top. Scale bar: 100 μm.