
|
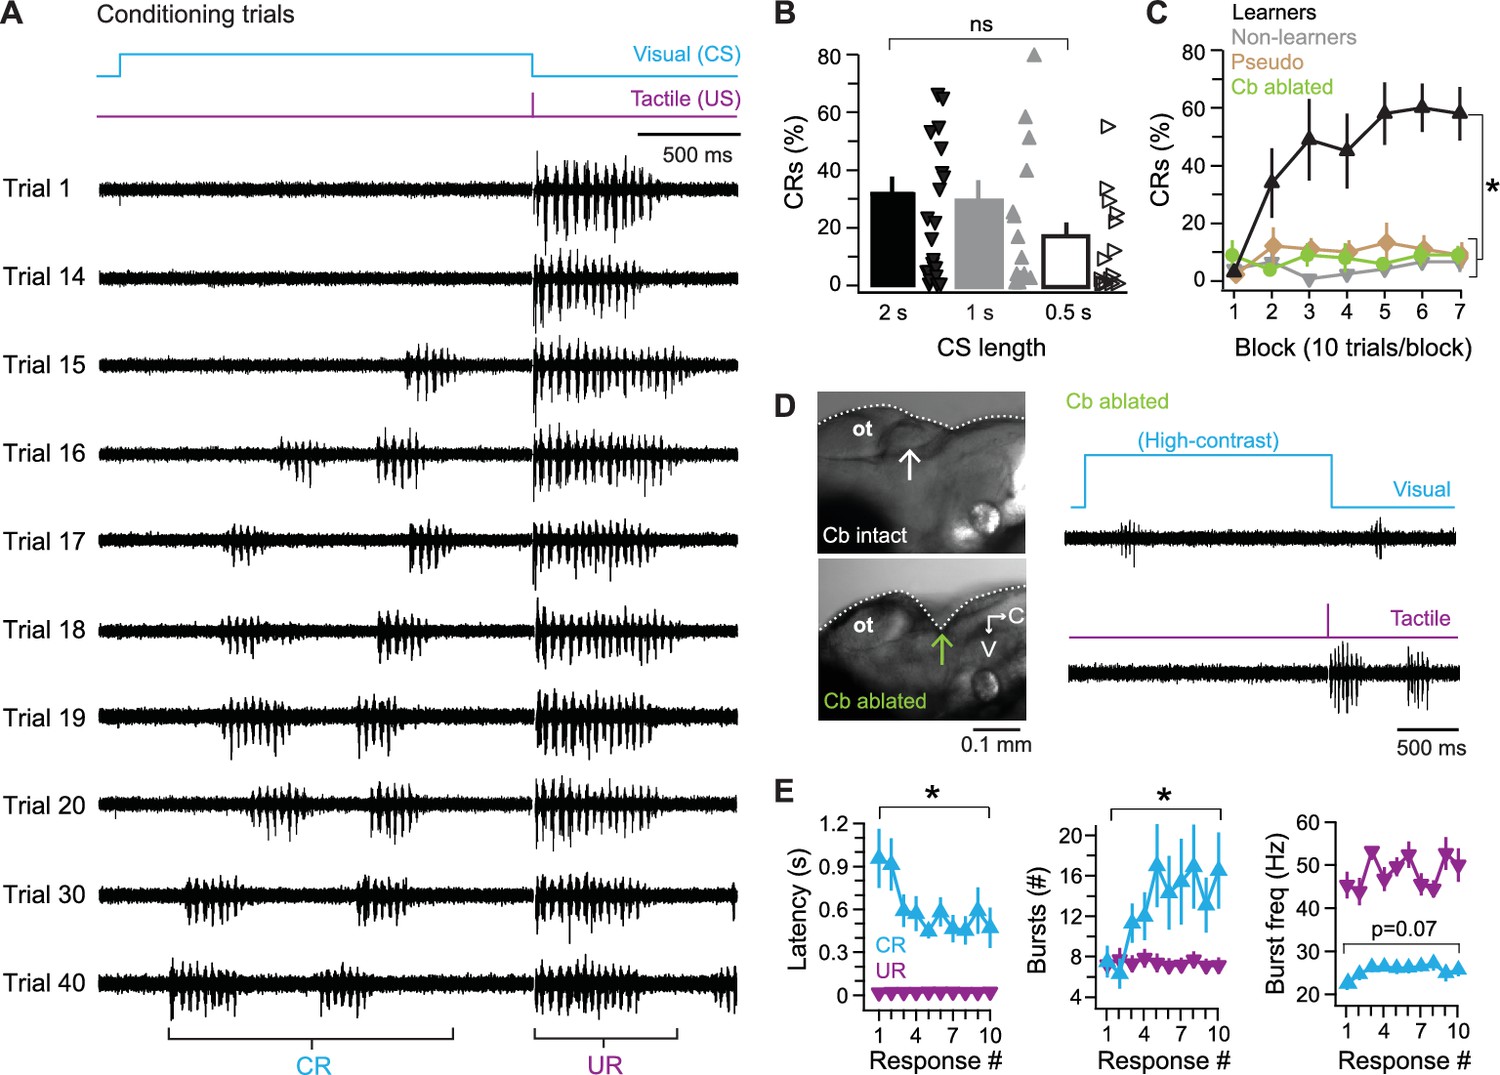
Fig. 3
Cerebellar associative learning.
(A) Sample ventral root recordings during training, illustrating the emergence and persistence of conditional responses (CRs) over time, as well as unconditional responses (URs). Trial numbers as indicated. Blue step, conditional stimulus (CS); purple step, unconditional stimulus (US). (B) Percentage of trials with a CR over all 70 trials. Bars are means; markers are data from individual fish; ns, not significant. F(2,49)=0.97. (C) Percentage of trials with a CR per 10-trial block for learner and non-learner groups from fish in (B) trained with 2 s CS. F(6,18)=4.92. (D) Left side view of exposed zebrafish brain before (top) and after (bottom) ablation of the cerebellum (arrow). V, ventral; C, caudal. Right, sample ventral root recordings of swimming evoked by a high-contrast visual stimulus (top) or tactile stimulus (bottom) after cerebellar ablation. (E) Changes in CR properties from first 10 CR trials in learner fish. UR data plotted for comparison. Left, swimming latency (relative to CS or US onset), CR: F(9,81)=3.80, UR: F(3.98,81) = 0.78, p=0.5. Middle, number of bursts per swim response, CR: F(9,81)=2.8, UR: F(9,81)=1.60, p=0.13. Right, frequency of bursts, CR: F(9,81)=2.84, UR: F(3.47,81) = 1.82, p=0.16.