
|
Fig. 1
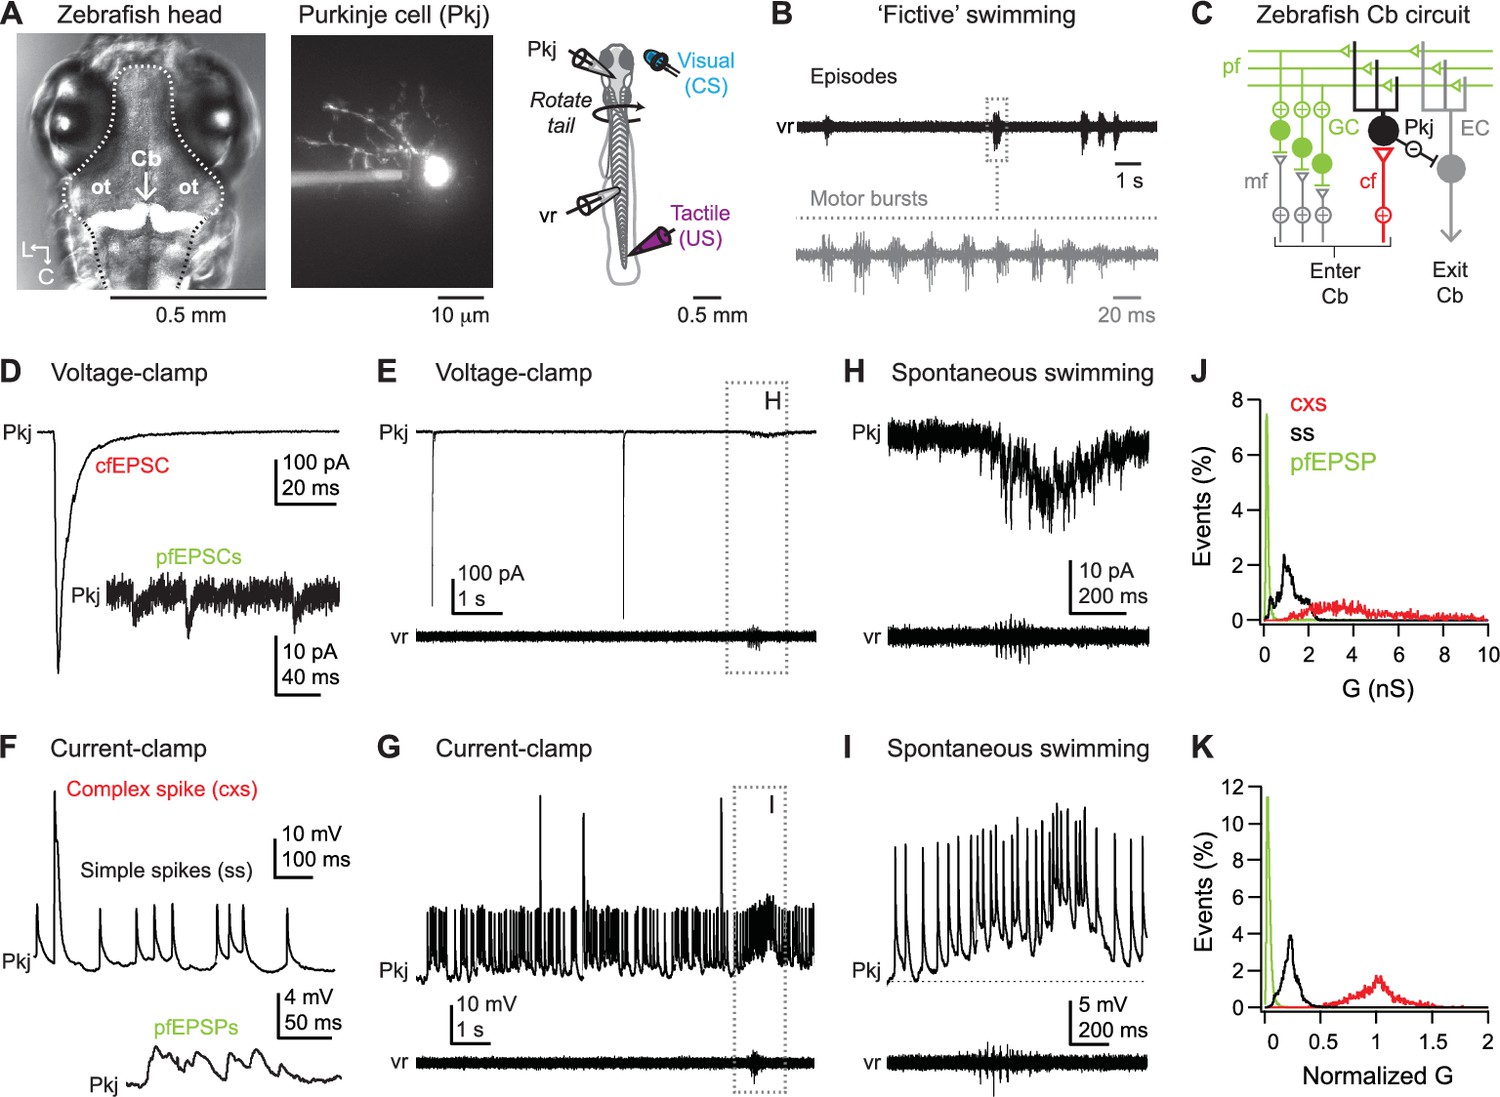
Spontaneous activity during dual recordings of Purkinje cells and ventral roots.
(A) Left, dorsal view of larval zebrafish head illustrating the location of the cerebellum (Cb, arrow). In this image, cerebellar Purkinje cells are fluorescently labeled by Archaerhodopsin-3 (white). Dotted line, outline of brain. ot: optic tectum. L, lateral; C, caudal. Middle, a Purkinje cell filled with Alexa Fluor 488. Right, schematic of the preparation. (B) Sample ventral root (vr) recording showing episodic bouts of fictive swimming (compressed time base, black) and cyclical motor bursts (expanded time base, grey). (C) Schematic of the zebrafish cerebellum. Pkj: Purkinje cell. EC: eurydendroid cell; GC: granule cell; cf: climbing fiber; mf: mossy fibers; pf: parallel fibers; Cb: cerebellum. (D) Sample voltage-clamp recording (holding potential = −60 mV, all voltage-clamp records) of cfEPSC and pfEPSCs (inset). (E) Sample voltage-clamp recording (top) and simultaneous vr recording (bottom). Box, episode of spontaneous swimming, expanded in (H). (F) Sample current-clamp recording of complex and simple spikes (top) and pfEPSPs (bottom). (G) Sample current-clamp recording of Purkinje cell spikes and simultaneous vr recording. Box, episode of spontaneous swimming, expanded in (I). Recordings in (E) and (G) are from the same cell. (H) Higher gain voltage-clamp and vr recording from (E) of clustered parallel fiber EPSCs during spontaneous swimming. (I) Higher gain current-clamp and vr recording from (G) of a parallel fiber driven long-lasting depolarization and simple spikes during spontaneous swimming. Dotted line, inter-spike potential (−56 mV) to illustrate depolarization. (J) Distribution of conductances associated with all complex spikes (cxs), simple spikes (ss), and parallel fiber EPSPs (pfEPSPs) included in the study. Absolute conductances (bin width, cxs and ss = 0.02 nS; pfEPSP = 0.01 nS). (K) As in (J) but conductances normalized to the mean cxs conductance in each cell (bin width = 0.005).